SunTrust 2005 Annual Report Download - page 48
Download and view the complete annual report
Please find page 48 of the 2005 SunTrust annual report below. You can navigate through the pages in the report by either clicking on the pages listed below, or by using the keyword search tool below to find specific information within the annual report.SUNTRUST ANNUAL REPORT46
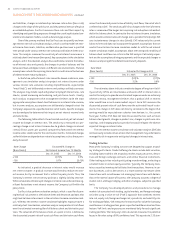
. million, or .%, from the fourth quarter of . The increase was
primarily related to merit increases and increased incentive costs. Outside
processing and software increased . million, or .%, due to higher
processing costs associated with higher transactional volumes. Consulting
fees increased . million, or .%, mainly due to the Mortgage line of
business’ initiative to enhance the efficiency of origination, processing and
distribution efforts, resulting in faster delivery of product into the second-
ary market. Also contributing to the increase in consulting fees were initia-
tives to enhance the Company’s risk management processes. Marketing and
customer development increased . million, or .%, due to market-
ing campaigns focused on retail loan and deposit products, Visa® gift cards,
and online banking services.
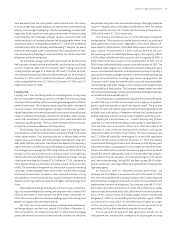
Provision for income taxes was . million for the fourth quarter
of compared to . million in the same period of . The pro-
vision represents an effective tax rate of .% for the fourth quarter of
, compared to .% for the fourth quarter of . The decrease in
the fourth quarter effective tax rate was due to AHG tax credits, an
annual true-up of the tax expense to the tax return as filed, and
a review of federal and state tax reserves.
EARNINGS AND BALANCE SHEET ANALYSIS VS.
CONSOLIDATED OVERVIEW
Net income was ,. million in , up .% from ,. million
earned in . Diluted earnings per share were . in and .
in . In , the Company incurred . million, or . per diluted
share, in after-tax merger expense associated with the acquisition of NCF.
Net interest income increased . million, or .%, to ,.
million in , compared to ,. million in . The increase was
due to the acquisition of NCF, healthy loan growth, and net interest margin
improvement. Rising interest rates throughout most of resulted in a
slow down of mortgage prepayments. NCF also contributed to the increase
due to the higher yield on NCF’s earning assets. The net interest margin
improved seven basis points to .% in from .% in . The
NCF acquisition accounted for three basis points of the net interest margin
increase. The improvement in the margin was attributed to multiple factors
including the Company’s balance sheet management, which was positioned
to benefit from higher interest rates and a steeper yield curve, significant
growth in lower cost deposits, a higher yield in the investment portfolio,
and a decrease in the cost of long-term debt.
Net charge-offs were . million, or .%, of average loans for
, compared to . million, or .%, of average loans for .
The Company benefited from a . million reduction in commercial
net charge-offs. The provision for loan losses decreased . million, or
.%, from to due to credit quality improvement in .
Noninterest income was ,. million in , compared
to ,. million in , an increase of . million, or .%.
Approximately million of the increase was attributable to NCF. Trust
and investment management income increased . million, or .%,
compared to due to increased assets under management, estate
settlement fees, and distribution fees. Retail investment services income
increased . million, or .%, due to higher brokerage and insurance
sales. NCF contributed approximately million of the increase in trust
and investment management income and approximately million of the
increase in retail investment services income.
Combined trading account profits and commissions and investment
banking income, the Company’s capital market revenue sources, increased
. million, or .%, compared to the prior year. The NCF acquisition
contributed approximately million of the increase and the remaining
increase was due to growth in the equity capital markets business. Service
charges on deposits increased . million, or .%, due to increased NSF/
stop payment volumes, increased pricing and other revenue enhancement
initiatives. Approximately million of the increase was attributable to
NCF. Other charges and fees increased . million, or .%, from
to as a result of increased letter of credit fees and insurance revenues.
Approximately million of the increase was attributable to NCF. Other
noninterest income increased . million, or .%, primarily due to
combined mortgage production and servicing related income, and the con-
solidation of certain affordable housing partnerships, which occurred in the
third quarter of .
Noninterest expense was ,. million in , compared
to ,. million in , an increase of . million, or .%.
Approximately million of the increase was attributable to the NCF
acquisition including . million of merger expense. Personnel expenses
increased . million, or .%, primarily due to the NCF acquisition,
increased headcount, merit increases, and incentive costs. Commissions
and performance based incentive payments increased as a result of busi-
ness growth, higher production volumes, and higher revenue in the Wealth
and Investment Management, Retail, Commercial, and CIB lines of business.
Net occupancy expense increased . million, or .%, due to increases
in rent, utility, and maintenance costs, primarily related to investments in
the retail distribution network. Outside processing and software expenses
increased . million, or .%, due to higher software amortization and
maintenance expense. Also impacting the increase in other noninterest
expense was the consolidation of certain affordable housing partnerships,
which contributed . million of the increase.
Average earning assets increased . billion, or .%, from to
, of which approximately billion was related to the NCF acquisition.
Average loans increased . billion, or .%, from to . The
acquisition of NCF contributed approximately billion of the increase in
loans. Securities available for sale increased . billion, or .%. Average
earning asset growth was offset by a decrease in average loans held for sale
of . billion, or .%, from to due to a decline in mortgage
production.
Average interest-bearing liabilities increased . billion, or .%,
from to , of which approximately billion was related to the
NCF acquisition. Average consumer and commercial deposits increased
. billion, or .%, compared to , primarily due to increases in DDA,
NOW accounts, and savings. Average demand deposits increased . bil-
lion, or .%, average NOW accounts increased . billion, or .%,
and average savings increased . billion, or .%, as the Company ben-
efited from campaigns to grow client deposits and the overall volatility in
the financial markets.
BUSINESS SEGMENTS
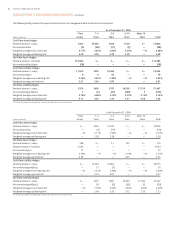
The following analysis details the operating results for each line of business
for the years ended December , and . These periods have been
restated to conform to the presentation.
MANAGEMENT’S DISCUSSION AND ANALYSIS continued


