SunTrust 2005 Annual Report Download - page 49
Download and view the complete annual report
Please find page 49 of the 2005 SunTrust annual report below. You can navigate through the pages in the report by either clicking on the pages listed below, or by using the keyword search tool below to find specific information within the annual report.SUNTRUST ANNUAL REPORT 47
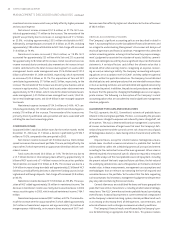
RETAIL
Retail’s total income before taxes for the twelve months ended December
, was . billion, an increase of . million, or .%, com-
pared to the same period in . This increase was attributable to the NCF
acquisition, higher net interest income, improved credit quality and higher
noninterest income partially offset by higher noninterest expense.
Net interest income increased . million, or .%. The NCF
acquisition contributed approximately million of the increase. The
remainder of the increase was attributable to loan and deposit growth and
widening deposit spreads. Average loans increased . billion, or .%,
while average deposits increased . billion, or .%. The NCF acquisi-
tion contributed approximately billion to the loan increase and approxi-
mately billion to the deposit increase. The remaining loan growth was
driven primarily by equity lines while the remaining deposit growth was
driven by demand deposits. Net charge-offs decreased . million, or
.%, primarily due to a decline in consumer indirect net charge-offs.
Noninterest income increased . million, or .%. The addition
of NCF contributed approximately million of the increase. The remain-
ing increase was driven primarily by higher service charges on deposit
accounts.
Noninterest expense increased . million, or .%. The addition
of NCF contributed approximately million of the increase. The remain-
ing increase was driven primarily by investments in the retail distribution
network and technology.
COMMERCIAL
Commercial’s total income before taxes for the twelve months ended
December , was . million, an increase of . million, or
.%, compared to the same period in . Income before taxes was
positively impacted by the inclusion of NCF results in the fourth quarter of
, and was partially offset by a decrease in AHG profitability.
Net interest income increased . million, or .%. Average loans
increased . billion, or .%. Average deposits increased . billion, or
.%. Loan growth was driven by the inclusion of NCF results in the fourth
quarter of , and higher demand for commercial and commercial real
estate loans. The growth in deposits was attributable to increased client
liquidity. Net charge-offs increased . million, or .%.
Noninterest income increased . million, or .%. The increase
was largely attributable to AHG related tax credits from new properties and
investments, as well as higher partnership revenue. Also contributing to the
increase was internal cross line of business sales credits. Partially offsetting
these increases were decreases in service charges on deposit accounts and
deposit sweep income. The decrease in the income from deposit accounts
was anticipated in a rising rate environment as clients earned a higher credit
on their deposits.
Noninterest expense increased . million, or .%. The increase
was largely attributable to AHG related partnership operating expenses and
impairment and other charges related to affordable housing properties.
The remaining increase was driven by indirect support costs and personnel
expense.
CORPORATE AND INVESTMENT BANKING
CIB’s total income before taxes for the twelve months ended December ,
was . million, an increase of . million, or .%, com-
pared to the same period in . A significant improvement in net charge-
offs and noninterest income contributed to the increase.
Net interest income decreased . million, or .%. Average loans
decreased . billion, or .%. Average deposits increased . billion, or
.%. The decrease in average loan balances was due to the deconsolida-
tion of the Company’s commercial paper conduit in March , weaker
corporate loan demand, and lower usage of revolving credit lines. Net
charge-offs decreased . million, or .%, as net charge-offs returned
to levels experienced prior to the most recent economic downturn.
Noninterest income increased . million, or .%, which was
driven by an increase in revenues from merchant banking coupled with an
increase in equity capital markets revenue.
Noninterest expense increased . million, or .%, primarily due
to an increase in personnel expense of . million, or .%. The increase
in personnel expense was driven by increased variable compensation asso-
ciated with increased fee income.
MORTGAGE
Mortgage’s total income before taxes for the twelve months ended
December , was . million, a decrease of . million, or
.%, compared to the same period in . Declines in production income
were only partially offset by higher earnings due to lower servicing amorti-
zation and higher servicing fees, as well as higher income from growth in the
residential mortgage portfolio.
Net interest income decreased . million, or .%. The primary
driver of this decrease was lower income from mortgage loans held for sale
that was only partially offset by higher residential portfolio loan income.
Average mortgage loans held for sale decreased . billion, or .%. The
decline in average balances combined with compressed margins resulted in
a . million, or .%, decrease in net interest income. Total average
portfolio loans, principally residential mortgages, increased . billion, or
.%, contributing . million to net interest income, an increase of
. million, or .%. Average deposit balances were lower by .
million due to reduced loan prepayments and resulted in a decline in net
interest income of . million. Net charge-offs remained at a low level but
increased . million, or .%.
Noninterest income increased . million. The increase in non-
interest income was driven by lower amortization of mortgage servicing
rights and higher servicing fee income. MSRs amortization declined .
million, or .%, due to slower loan prepayments. Servicing fees increased
. million, or .%, principally due to higher servicing balances. The
servicing portfolio was . billion at December , compared with
. billion at December , . The increase in servicing income was
partially offset by lower loan production income, which declined . mil-
lion, or .%. Lower production volumes and compressed margins drove
the production income decline.
Noninterest expense increased . million, or .%. Higher per-
sonnel expense and expenditures related to sales promotions and growth
initiatives were the primary drivers. The higher personnel expense was prin-
cipally a result of sales force growth and higher benefit costs.
WEALTH AND INVESTMENT MANAGEMENT
Wealth and Investment Management’s total income before taxes for the
twelve months ended December , was . million, an increase
of . million, or .%, compared to the same period in . NCF
represented approximately million while Seix and ZCI represented
approximately million of the increase. The remainder of the growth was
primarily driven by increased net interest income, trust income, and retail


