SunTrust 2005 Annual Report Download - page 38
Download and view the complete annual report
Please find page 38 of the 2005 SunTrust annual report below. You can navigate through the pages in the report by either clicking on the pages listed below, or by using the keyword search tool below to find specific information within the annual report.-
 1
1 -
2
-
3
-
4
-
5
-
6
-
7
-
8
-
9
-
10
-
11
-
12
-
13
-
14
-
15
-
16
-
17
-
18
-
19
-
20
-
21
-
22
-
23
-
24
-
25
-
26
-
27
-
 28
28 -
 29
29 -
 30
30 -
 31
31 -
 32
32 -
 33
33 -
 34
34 -
 35
35 -
 36
36 -
 37
37 -
 38
38 -
 39
39 -
 40
40 -
 41
41 -
 42
42 -
 43
43 -
 44
44 -
 45
45 -
 46
46 -
 47
47 -
 48
48 -
49
-
50
-
51
-
52
-
53
-
54
-
55
-
56
-
57
-
58
-
59
-
60
-
61
-
62
-
63
-
64
-
65
-
66
-
67
-
68
-
69
-
70
-
71
-
72
-
73
-
74
-
75
-
76
-
77
-
78
-
79
-
80
-
81
-
82
-
83
-
84
-
85
-
86
-
87
-
88
-
89
-
90
-
91
-
92
-
93
-
94
-
95
-
96
-
97
-
98
-
99
-
100
-
101
-
102
-
103
-
104
-
105
-
106
-
107
-
108
-
109
-
110
-
111
-
112
-
113
-
114
-
115
-
116
 |
 |

SUNTRUST ANNUAL REPORT36
and liabilities, changes in relationships between rate indices (basis risk),
changes in the shape of the yield curve, and the potential exercise of explicit
or embedded options. SunTrust measures these risks and their impact by
identifying and quantifying exposures through the use of sophisticated sim-
ulation and valuation models, as well as duration gap analysis.
One of the primary methods that SunTrust uses to quantify and man-
age interest rate risk is simulation analysis, which is used to model net inter-
est income from assets, liabilities, and derivative positions over a specified
time period under various interest rate scenarios and balance sheet struc-
tures. This analysis measures the sensitivity of net interest income over a
relatively short time horizon (two years). Key assumptions in the simulation
analysis, and in the valuation analysis discussed below, relate to the behav-
ior of interest rates and spreads, the changes in product balances and the
behavior of loan and deposit clients in different rate environments. Material
assumptions include the repricing characteristics and balance fluctuations
of indeterminate maturity deposits.
As the future path of interest rates cannot be known in advance, man-
agement uses simulation analysis to project net interest income under
various interest rate scenarios including implied forwards, expected (or
“most likely”), and deliberately extreme and perhaps unlikely scenarios.
The analyses may include rapid and gradual ramping of interest rates, rate
shocks, spread narrowing and widening, and yield curve twists. Usually,
each analysis incorporates what management believes to be the most
appropriate assumptions about client behavior in an interest rate scenario,
but in some analyses, assumptions are deliberately changed to test the
Company’s exposure to a specified event or set of events. Specific strategies
are also analyzed to determine their impact on net interest income levels
and sensitivities.
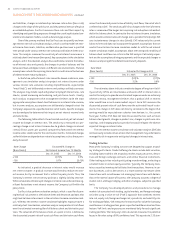
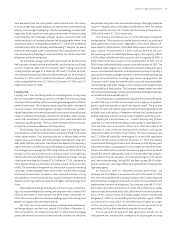
The following table reflects the estimated sensitivity of net interest
income to changes in interest rates. The sensitivity is measured as a per-
centage change in net interest income due to gradual changes in interest
rates ( basis points per quarter) compared to forecasted net interest
income under stable rates for the next twelve months. Estimated changes
set forth below are dependent on material assumptions such as those previ-
ously discussed.
Rate Change Estimated % Change in
(Basis Points) Net Interest Income Over Months
Dec. , Dec. ,
+ (.)% .%
- .% (.)%
As indicated, a gradual decrease in interest rates would increase
net interest income. A gradual increase would tend to reduce net inter-
est income, but by an amount that is within the policy limits. Thus, the
Company’s interest rate sensitivity position is slightly liability sensitive.
While simulations of more rapid changes in interest rates indicate more sig-
nificant fluctuations in net interest income, the Company is still within the
policy limits.
SunTrust also performs valuation analysis, which is used for discern-
ing levels of risk present in the balance sheet and derivative positions that
might not be taken into account in the net interest income simulation anal-
ysis. Whereas net interest income simulation highlights exposures over a
relatively short time horizon, valuation analysis incorporates all cash flows
over the estimated remaining life of all balance sheet and derivative posi-
tions. The valuation of the balance sheet, at a point in time, is defined as
the discounted present value of asset cash flows and derivative cash flows
minus the discounted present value of liability cash flows, the net of which
is referred to as EVE. The sensitivity of EVE to changes in the level of interest
rates is a measure of the longer-term repricing risk and options risk embed-
ded in the balance sheet. In contrast to the net interest income simulation,
which assumes interest rates will change over a period of time (ramp), EVE
uses instantaneous changes in rates (shock). EVE values only the current
balance sheet and does not incorporate the growth assumptions that are
used in the net interest income simulation model. As with the net interest
income simulation model, assumptions about the timing and variability of
balance sheet cash flows are critical in the EVE analysis. Particularly impor-
tant are the assumptions driving prepayments and the expected changes in
balances and pricing of the indeterminate maturity deposits.
Rate Shock
(Basis Points) Estimated % Change in EVE
Dec. , Dec. ,
+ (.)% (.)%
- .% .%
The estimates above indicate a moderate degree of long-term liabil-
ity sensitivity. While an instantaneous and severe shift in interest rates is
used in this analysis to provide an estimate of exposure under an extremely
adverse scenario, management believes that a gradual shift in interest
rates would have a much more modest impact. Since EVE measures the
discounted present value of cash flows over the estimated lives of instru-
ments, the change in EVE does not directly correlate to the degree that
earnings would be impacted over a shorter time horizon; i.e., the current
fiscal year. Further, EVE does not take into account factors such as future
balance sheet growth, changes in product mix, changes in yield curve rela-
tionships, and changing product spreads that could mitigate the adverse
impact of changes in interest rates.
The net interest income simulation and valuation analyses (EVE) do
not necessarily include certain actions that management may undertake to
manage this risk in response to anticipated changes in interest rates.
Trading Activities
Most of the Company’s trading activities are designed to support second-
ary trading with clients. Product offerings to clients include debt securities,
including loans traded in the secondary market, equity securities, deriva-
tives and foreign exchange contracts, and similar financial instruments.
Other trading activities include participating in underwritings, and acting as
a market maker in certain equity securities. Typically, the Company main-
tains a securities inventory to facilitate client transactions. However, in cer-
tain businesses, such as derivatives, it is more common to execute client
transactions with simultaneous risk-managing transactions with dealers.
Also in the normal course of business, the Company assumes a degree of
market risk in arbitrage, hedging, and other strategies, subject to specified
limits.
The Company has developed policies and procedures to manage
market risk associated with trading, capital markets, and foreign exchange
activities using a value-at-risk (“VaR”) approach that combines interest
rate risk, equity risk, foreign exchange risk, spread risk, and volatility risk.
For trading portfolios, VaR measures the maximum fair value the Company
could lose on a trading position, given a specified confidence level and time
horizon. VaR limits and exposures are monitored daily for each significant
trading portfolio. The Company’s VaR calculation measures the potential
losses in fair value using a % confidence level. This equates to . stan-
MANAGEMENT’S DISCUSSION AND ANALYSIS continued