SunTrust 2005 Annual Report Download - page 50
Download and view the complete annual report
Please find page 50 of the 2005 SunTrust annual report below. You can navigate through the pages in the report by either clicking on the pages listed below, or by using the keyword search tool below to find specific information within the annual report.-
 1
1 -
2
-
3
-
4
-
5
-
6
-
7
-
8
-
9
-
10
-
11
-
12
-
13
-
14
-
15
-
16
-
17
-
18
-
19
-
20
-
21
-
22
-
23
-
24
-
25
-
26
-
27
-
28
-
29
-
30
-
31
-
32
-
33
-
34
-
35
-
36
-
37
-
38
-
39
-
 40
40 -
 41
41 -
 42
42 -
 43
43 -
 44
44 -
 45
45 -
 46
46 -
 47
47 -
 48
48 -
 49
49 -
 50
50 -
 51
51 -
 52
52 -
 53
53 -
 54
54 -
 55
55 -
 56
56 -
 57
57 -
 58
58 -
 59
59 -
 60
60 -
61
-
62
-
63
-
64
-
65
-
66
-
67
-
68
-
69
-
70
-
71
-
72
-
73
-
74
-
75
-
76
-
77
-
78
-
79
-
80
-
81
-
82
-
83
-
84
-
85
-
86
-
87
-
88
-
89
-
90
-
91
-
92
-
93
-
94
-
95
-
96
-
97
-
98
-
99
-
100
-
101
-
102
-
103
-
104
-
105
-
106
-
107
-
108
-
109
-
110
-
111
-
112
-
113
-
114
-
115
-
116
 |
 |
SUNTRUST ANNUAL REPORT48
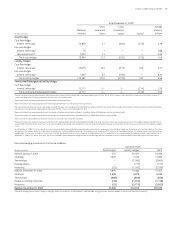
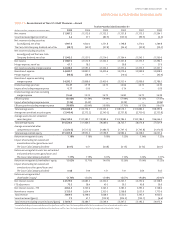
investment services income which was partially offset by higher personnel
and structural expense.
Net interest income increased . million, or .%. NCF con-
tributed approximately million to the increase. The remainder of the
growth was primarily due to increases in average loans of . billion,
or .%, including approximately million attributable to NCF.
Additionally, average deposits increased . billion, or .%, including
approximately million attributable to NCF. Net charge-offs increased
. million, or .%.
Noninterest income increased . million, or .%. NCF
accounted for approximately million while Seix and ZCI accounted
for approximately million of the increase. Retail investment services
income increased due to continued sales momentum. An increase in trust
income contributed to the total increase due to growth in assets under
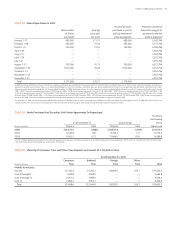
management. Assets under management were . billion and .
billion as of December , and , respectively, which represented
an increase of . billion, or .%. The acquisitions of Seix and NCF
contributed approximately billion and billion, respectively, to the
increase. The remainder of the increase was driven by new business and an
increase in equity markets. SunTrust’s total assets under advisement were
approximately . billion, which include the aforementioned assets
under management, . billion in non-managed trust assets, . bil-
lion in retail brokerage assets, and . billion in non-managed corporate
trust assets.
Noninterest expense increased . million, or .%. NCF con-
tributed approximately million while Seix and ZCI contributed approxi-
mately million of the increase. The remainder of the increase was
primarily driven by additional sales personnel and costs associated with
installing the new trust accounting system.
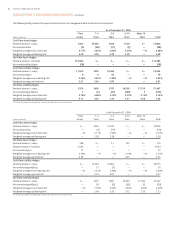
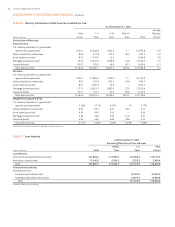
CORPORATE/OTHER
Corporate/Other’s total loss before taxes for the twelve months ended
December , was . billion, a decline in profitability of .
million, or .%, compared to the same period in .
Net interest income increased . million due to a . million
spread increase on the investment portfolio. This was partially offset by the
impact of NCF which represented an approximate million decline in net
interest income.
Total assets decreased . billion, or .%. The decline was due to
a . billion decline in intercompany loans offset by approximately
billion of NCF assets and a . billion increase in the securities portfolio.
Total liabilities increased . billion, or .%. The increase was due to a
. billion increase in long-term debt and approximately billion of NCF
liabilities, partially offset by declines in short term funding sources includ-
ing brokered and foreign deposits. Net charge-offs increased . million,
or .%.
Noninterest income decreased . million, or .%. The acqui-
sition of NCF added approximately million in noninterest income. The
decrease in noninterest income was mainly due to securities losses in
versus securities gains in , which reduced noninterest income .
million.
Noninterest expense increased . million, or .%. The main driv-
ers of the increase were the acquisition of NCF, which added approximately
million of noninterest expense and approximately million of
merger expense. Additionally, an increase in direct expenses of . mil-
lion was more than offset by higher cost allocations to the lines of business
of . million.
CRITICAL ACCOUNTING POLICIES
The Company’s significant accounting policies are described in detail in
Note , Accounting Policies, to the Consolidated Financial Statements and
are integral to understanding Management’s Discussion and Analysis of
results of operations and financial condition. Management has identified
certain accounting policies as being critical because they require manage-
ment’s judgment to ascertain the valuation of assets, liabilities, commit-
ments and contingencies and they have a significant impact on the financial
statements. A variety of factors could affect the ultimate value that is
obtained either when earning income, recognizing an expense, recover-
ing an asset, or reducing a liability. The Company’s accounting and report-
ing policies are in accordance with US GAAP, and they conform to general
practices within the applicable industries. The Company has established
detailed policies and control procedures that are intended to ensure these
critical accounting estimates are well controlled and applied consistently
from period to period. In addition, the policies and procedures are intended
to ensure that the process for changing methodologies occurs in an appro-
priate manner. The following is a description of the Company’s current
accounting policies that are considered to involve significant management
valuation judgments.
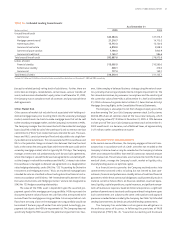
ALLOWANCE FOR LOAN AND LEASE LOSSES
The ALLL represents the ALLL Committee’s estimate of probable losses
inherent in the existing loan portfolio. The ALLL is increased by the provision
for loan losses charged to expense and reduced by loans charged off, net
of recoveries. The ALLL is determined based on management’s assessment
of reviews and evaluations of larger loans that meet the Company’s defi-
nition of impairment and the size and current risk characteristics of pools
of homogeneous loans (i.e., loans having similar characteristics) within the
portfolio.
Impaired loans, except for smaller balance homogeneous loans,
include loans classified as nonaccrual where it is probable that SunTrust
will be unable to collect the scheduled payments of principal and interest
according to the contractual terms of the loan agreement. When a loan is
deemed impaired, the amount of specific allowance required is measured
by a careful analysis of the most probable source of repayment, including
the present value of the loan’s expected future cash flows, the fair value of
the underlying collateral less costs of disposition, or the loan’s estimated
market value. In these measurements, management uses assumptions and
methodologies that are relevant to estimating the level of impaired and
unrealized losses in the portfolio. To the extent that the data supporting
such assumptions has limitations, management’s judgment and experience
play a key role in enhancing the ALLL estimates.
General allowances are established for loans and leases grouped into
pools that have similar characteristics, including smaller balance homoge-
neous loans. The ALLL Committee estimates probable losses by evaluating
several factors: historical loss experience, current internal risk ratings based
on the Company’s internal risk rating system, internal portfolio trends such
as increasing or decreasing levels of delinquencies, concentrations, and
external influences such as changes in economic or industry conditions.
The Company’s financial results are influenced by the Company’s pro-
cess for determining an appropriate level for its ALLL. This process involves
MANAGEMENT’S DISCUSSION AND ANALYSIS continued