SunTrust 2005 Annual Report Download - page 31
Download and view the complete annual report
Please find page 31 of the 2005 SunTrust annual report below. You can navigate through the pages in the report by either clicking on the pages listed below, or by using the keyword search tool below to find specific information within the annual report.-
 1
1 -
2
-
3
-
4
-
5
-
6
-
7
-
8
-
9
-
10
-
11
-
12
-
13
-
14
-
15
-
16
-
17
-
18
-
19
-
20
-
 21
21 -
 22
22 -
 23
23 -
 24
24 -
 25
25 -
 26
26 -
 27
27 -
 28
28 -
 29
29 -
 30
30 -
 31
31 -
 32
32 -
 33
33 -
 34
34 -
 35
35 -
 36
36 -
 37
37 -
 38
38 -
 39
39 -
 40
40 -
 41
41 -
42
-
43
-
44
-
45
-
46
-
47
-
48
-
49
-
50
-
51
-
52
-
53
-
54
-
55
-
56
-
57
-
58
-
59
-
60
-
61
-
62
-
63
-
64
-
65
-
66
-
67
-
68
-
69
-
70
-
71
-
72
-
73
-
74
-
75
-
76
-
77
-
78
-
79
-
80
-
81
-
82
-
83
-
84
-
85
-
86
-
87
-
88
-
89
-
90
-
91
-
92
-
93
-
94
-
95
-
96
-
97
-
98
-
99
-
100
-
101
-
102
-
103
-
104
-
105
-
106
-
107
-
108
-
109
-
110
-
111
-
112
-
113
-
114
-
115
-
116
 |
 |

SUNTRUST ANNUAL REPORT 29
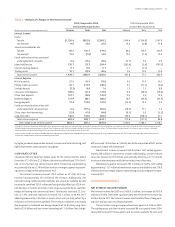
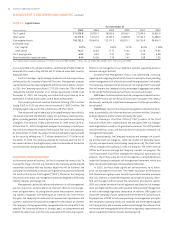
LOANS
On April , , NCF’s system applications were converted to SunTrust’s
system applications. In some cases, NCF classified loans differently for
financial reporting purposes compared to the SunTrust methodology. While
prior to the conversion NCF loan accounts were mapped as closely as pos-
sible to SunTrust’s classifications, it was anticipated that additional reclas-
sifications could occur once the systems conversions were completed. The
Company deemed it impractical to restate prior periods for shifts within
loan and deposit categories resulting from the systems application conver-
sions. However, the Company has estimated the approximate impact of the
reclassifications on certain loan categories as described below.
The Company’s loan portfolio increased . billion, or .%, from
December , to December , . Commercial loans increased
. billion, or .%, compared to December , due to growth in
large corporate loans and continued growth in the small to mid-sized com-
mercial portfolios. The Company estimated there were approximately
billion of commercial real estate loans that were classified as commercial
loans as of December , . Considering the impact of the systems con-
versions, the estimated commercial loan growth rate was estimated to be
in the low double digit range and commercial real estate was estimated to
be down slightly compared to December , . Residential mortgages
increased . billion, or .%, compared to December , . This
growth was due to continued demand for portfolio products. The Company
estimated there was approximately billion of residential mortgages
which were included in the construction and consumer categories as of
December , . Considering the impact of the systems conversions,
the estimated residential mortgage growth rate was estimated to be in low
double digit range compared to December , . Home equity loans
increased . billion, or .%, compared to December , , primar-
ily due to an increased sales focus through the retail network. The Company
estimates the systems conversions had minimal impact on the home equity
category.
Loans held for sale, which predominantly consists of warehoused
mortgage loans, were . billion, an increase of . billion, or .%,
from December , . The increase was due to continued strong mort-
gage production resulting from the Company’s focus on growing its mort-
gage business.
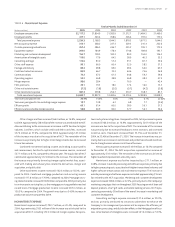
ALLOWANCE FOR LOAN AND LEASE LOSSES
SunTrust continuously monitors the quality of its loan portfolio and main-
tains an ALLL sufficient to absorb probable losses inherent in its total loan
portfolio. The Company is committed to the early recognition of problem
loans and to an appropriate and adequate level of allowance. At year end
, the Company’s total allowance was . billion, which represented
.% of year end loans.
In addition to the review of credit quality through the ongoing credit
review processes, the Company employs a variety of modeling and estima-
tion tools for measuring credit risk that are used to construct an appropriate
allowance for credit losses. The Company’s allowance framework has three
basic elements: a formula-based component for pools of homogeneous
loans; specific allowances for loans reviewed for individual impairment;
and a non-pool-specific allowance based on other inherent risk factors
and imprecision associated with modeling and estimation processes. This
framework enables the Company to better align loss estimation practices
with the different types of credit risk inherent in the loan portfolio.
The first element — the general allowance for homogeneous loan
pools — is determined by applying allowance factors to pools of loans
within the portfolio that have similar characteristics in terms of line of busi-
ness and product type. The general allowance factors are determined using
a baseline factor that is developed from an analysis of historical charge-off
experience and expected losses, which are in turn based on estimated prob-
abilities of default and losses given default derived from an internal risk rat-
ing process. These baseline factors are developed and applied to the various
loan pools. Adjustments are made to the baseline factor for specific loan
pools based on an assessment of internal and external influences on credit
quality that have not yet been reflected in the historical loss or risk-rat-
ing data. These influences may include elements such as changes in credit
underwriting or recent observable asset quality trends. Finally, the baseline
factors are adjusted using a number of models which are intended to com-
pensate for internal and external portfolio and economic influences that
may not be captured in the adjusted baseline factors. The Company contin-
ually evaluates its allowance methodology seeking to refine and enhance
this process as appropriate, and it is likely that the methodology will evolve
over time. As of December , and , the general allowance calcu-
lations totaled . million and . million, respectively. The increase
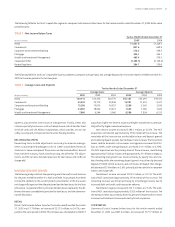
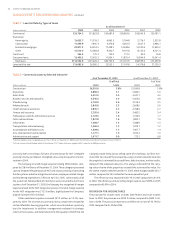
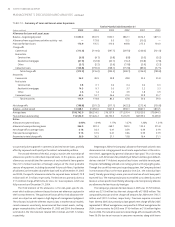
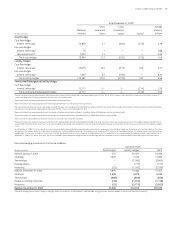
TABLE • Allowance for Loan and Lease Losses
As of December
(Dollars in millions)
Allocation by Loan Type
Commercial . . . . . .
Real estate . . . . . .
Consumer loans . . . . . .
Non-pool specific element . . . . . .
Total ,. ,. . . . .
Year End Loan Types as a Percent of Total Loans
Commercial .% .% .% .% .% .%
Real estate . . . . . .
Consumer loans . . . . . .
Total .% .% .% .% .% .%
The and allocation reflects the implementation of a new ALLL methodology that is more granular than in prior periods. The new methodology segregates the portfolio into sub-portfolios and incorporates a
weighted average of expected loss derived from an internal risk rating system. The and allocation also includes the acquired portfolio of NCF.
In and prior periods, the allocation reflected an apportionment of the ALLL that had been categorized as “environmental factors,” which is now included in the Company’s homeogeneous loan pool estimates.