SunTrust 2005 Annual Report Download - page 28
Download and view the complete annual report
Please find page 28 of the 2005 SunTrust annual report below. You can navigate through the pages in the report by either clicking on the pages listed below, or by using the keyword search tool below to find specific information within the annual report.-
 1
1 -
2
-
3
-
4
-
5
-
6
-
7
-
8
-
9
-
10
-
11
-
12
-
13
-
14
-
15
-
16
-
17
-
 18
18 -
 19
19 -
 20
20 -
 21
21 -
 22
22 -
 23
23 -
 24
24 -
 25
25 -
 26
26 -
 27
27 -
 28
28 -
 29
29 -
 30
30 -
 31
31 -
 32
32 -
 33
33 -
 34
34 -
 35
35 -
 36
36 -
 37
37 -
 38
38 -
39
-
40
-
41
-
42
-
43
-
44
-
45
-
46
-
47
-
48
-
49
-
50
-
51
-
52
-
53
-
54
-
55
-
56
-
57
-
58
-
59
-
60
-
61
-
62
-
63
-
64
-
65
-
66
-
67
-
68
-
69
-
70
-
71
-
72
-
73
-
74
-
75
-
76
-
77
-
78
-
79
-
80
-
81
-
82
-
83
-
84
-
85
-
86
-
87
-
88
-
89
-
90
-
91
-
92
-
93
-
94
-
95
-
96
-
97
-
98
-
99
-
100
-
101
-
102
-
103
-
104
-
105
-
106
-
107
-
108
-
109
-
110
-
111
-
112
-
113
-
114
-
115
-
116
 |
 |

SUNTRUST ANNUAL REPORT26
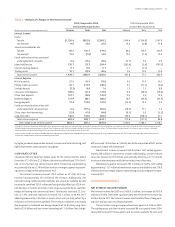
increased basis points from the prior year. The increase in loan yield was
due in part to the increase in yield on floating-rate loans which benefited
from the increase in short-term market interest rates. In addition, the yield
on new fixed rate loan production increased as long term interest rates were
also higher in . The increase in securities available for sale yield was due
to reinvestment of lower-yielding investment cash flows into higher-yield-
ing investments during . In , the total interest-bearing liability
cost increased basis points from . Growth in noninterest-bearing
DDA of . billion, or .%, mitigated the impact of these higher funding
costs on the margin.
The relatively flat margin was due more specifically to a number of
factors. The Company’s balance sheet was positioned to benefit from
higher rates and a steeper yield curve. During , while both short- and
long-term interest rates increased, the yield curve flattened considerably.
While one-month LIBOR increased basis points on average in ,
the five-year swap rate only increased basis points. The Company’s
prime rate averaged .% for , an increase of approximately
basis points from . The Federal Reserve Bank Fed Funds rate averaged
.% for , approximately basis points over the average.
The improvement in margin compared to was mitigated by an increase
in the size of the loans held for sale portfolio, whose spread decreased
commensurate with the flattening of the yield curve. A factor supporting the
net interest margin was the significant growth in lower cost deposits, mainly
DDA and NOW accounts. Average DDA and NOW accounts increased .
billion, or .%, compared to . The NCF merger accounted for slightly
more than one-half of the increase. The growth in DDA and NOW accounts
replaced more expensive wholesale funding, helping maintain the margin in
. The margin also benefited from the improvement in investment port-
folio yield. The reasons for the improvement are covered in the Securities
Available for Sale discussion beginning on page .
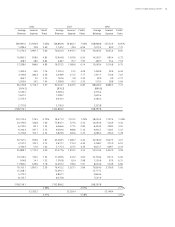
Average earning assets increased . billion, or .%, and aver-
age interest-bearing liabilities increased . billion, or .%, versus
. Average loans rose . billion, average securities available for sale
increased . billion, and average loans held for sale increased . billion
in . Loans held for sale increased due largely to an increase in mortgage
production.
The Company continued to take steps to obtain alternative lower
cost funding sources, such as developing initiatives to grow client deposits.
Campaigns to attract client deposits were implemented in and .
Interest income that the Company was unable to recognize on non-
accrual loans had a negative impact of one basis point on the net interest
margin in and no impact in .
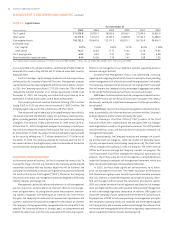
NONINTEREST INCOME
Noninterest income for was ,. million, an increase of .
million, or .%, compared to . Approximately million of the
increase was attributable to NCF. Positively impacting noninterest income
were increases in service charges on deposits, wealth management income
(the combination of trust and investment management income and retail
investment services), other charges and fees, card fees, and mortgage
related income (classified in other noninterest income). Additionally, net
securities losses decreased . million, or .%, compared to , and
the Company realized a net gain of . million on the sale of RCM assets
in . On March , , SunTrust sold substantially all of the factoring
assets of RCM to CIT Group, Inc. The sale of approximately million in
net assets resulted in a gain that was partially offset by expenses primarily
related to the severance of RCM employees and the write-off of obsolete
financial systems.
Service charges on deposit accounts increased . million, or
.%, compared to . NCF accounted for approximately million
of the increase. The impact of NCF was offset by a decrease in account anal-
ysis service charges on commercial accounts, due to higher client compen-
sating balances and increased client earnings credit rates, driven by rising
short-term interest rates in .
Trust and investment management income increased . million,
or .%, compared to . NCF contributed approximately million
of the increase. An overall increase in assets under management resulted
in higher income, as well as the acquisition of Seix in May of . Retail
investment services income increased . million, or .%, compared
to the prior year. Approximately million of the increase was attributable
to NCF, and the remaining increase was due to continued sales momentum
in the Wealth and Investment Management segment.
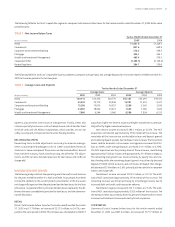
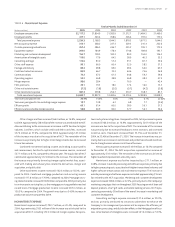
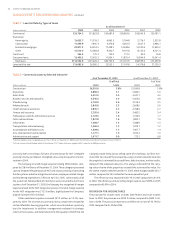
TABLE • Noninterest Income
Twelve Months Ended December
(Dollars in millions)
Service charges on deposit accounts . . . . . .
Trust and investment management income . . . . . .
Retail investment services . . . . . .
Other charges and fees . . . . . .
Investment banking income . . . . . .
Trading account profits and commissions . . . . . .
Card fees . . . . . .
Net gain on sale of RCM assets . — — — — —
Other noninterest income . . . . . .
Total noninterest income before securities
(losses)/gains ,. ,. ,. ,. ,. ,.
Securities (losses)/gains (.) (.) . . . .
Total noninterest income ,. ,. ,. ,. ,. ,.
Year-over-year growth rate in noninterest
income before securities (losses)/gains .% .% .% .% .%
MANAGEMENT’S DISCUSSION AND ANALYSIS continued