SunTrust 2005 Annual Report Download - page 25
Download and view the complete annual report
Please find page 25 of the 2005 SunTrust annual report below. You can navigate through the pages in the report by either clicking on the pages listed below, or by using the keyword search tool below to find specific information within the annual report.-
 1
1 -
2
-
3
-
4
-
5
-
6
-
7
-
8
-
9
-
10
-
11
-
12
-
13
-
14
-
 15
15 -
 16
16 -
 17
17 -
 18
18 -
 19
19 -
 20
20 -
 21
21 -
 22
22 -
 23
23 -
 24
24 -
 25
25 -
 26
26 -
 27
27 -
 28
28 -
 29
29 -
 30
30 -
 31
31 -
 32
32 -
 33
33 -
 34
34 -
 35
35 -
36
-
37
-
38
-
39
-
40
-
41
-
42
-
43
-
44
-
45
-
46
-
47
-
48
-
49
-
50
-
51
-
52
-
53
-
54
-
55
-
56
-
57
-
58
-
59
-
60
-
61
-
62
-
63
-
64
-
65
-
66
-
67
-
68
-
69
-
70
-
71
-
72
-
73
-
74
-
75
-
76
-
77
-
78
-
79
-
80
-
81
-
82
-
83
-
84
-
85
-
86
-
87
-
88
-
89
-
90
-
91
-
92
-
93
-
94
-
95
-
96
-
97
-
98
-
99
-
100
-
101
-
102
-
103
-
104
-
105
-
106
-
107
-
108
-
109
-
110
-
111
-
112
-
113
-
114
-
115
-
116
 |
 |

SUNTRUST ANNUAL REPORT 23
by higher personnel expense due to merit increases and selective hiring, and
higher expense for amortization of intangibles.
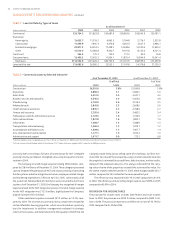
CORPORATE/OTHER
Corporate/Other’s total loss before taxes for the twelve months ended
December , was . billion, a decline in profitability of . mil-
lion, or .%, from the same period in . The decline in profitability
was primarily due to a . million increase in merger expense represent-
ing costs to integrate the operations of NCF.
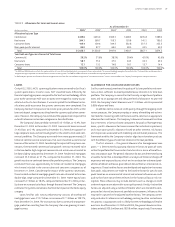
Net interest income increased . million, or .%. NCF rep-
resented approximately million of the increase. Additionally, net
internal funding credits on other liabilities and securities available for sale
increased a combined . million and was partially offset by a . mil-
lion decrease in income on interest rate swaps accounted for as cash flow
hedges of floating rate commercial loans. Total assets increased . bil-
lion, or .%, and total liabilities increased . billion, or .%. NCF
added approximately billion in assets which was partially offset by a
reduction in the investment portfolio. The increase in liabilities was mainly
due to growth in brokered and foreign deposits of . billion, long-term
debt of . billion and short-term borrowings of . billion. Net charge-
offs increased . million, or .%, due to the acquisition of NCF and an
increase in charge-offs at Bankcard.
Noninterest income increased . million. NCF added approxi-
mately million in noninterest income. Additionally, smaller realized
securities losses of . million were partially offset by a . million
increase in intercompany credits to the various lines of business.
Noninterest expense increased . million, or .%. NCF added
approximately million of noninterest expense in addition to the .
million increase in merger expense representing costs to integrate the oper-
ations of NCF.
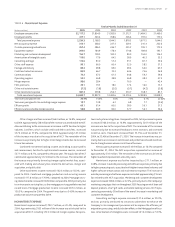
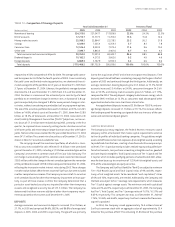
CONSOLIDATED RESULTS
NET INTEREST INCOME/MARGIN
Net interest income for was ,. million, an increase of .
million, or .%, from . Approximately two-thirds of the increase was
attributable to NCF. Net interest income also benefited from strong earn-
ing asset and low-cost retail deposit growth.
The net interest margin improved one basis point to .% in .
The earning asset yield for the year increased basis points from .
Loan yield increased basis points and securities available for sale yield
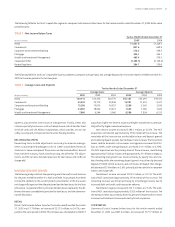
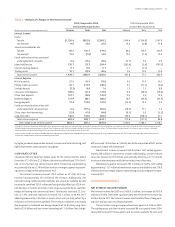
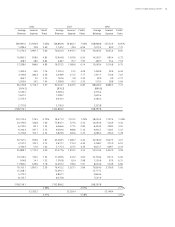
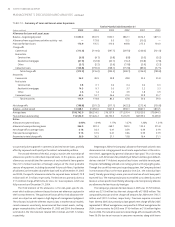
TABLE • Analysis of Changes in Net Interest Income
Compared to Compared to
Increase (Decrease) Due to Increase (Decrease) Due to
(Dollars in millions on a taxable-equivalent basis) Volume Rate Net Volume Rate Net
Interest Income
Loans:
Taxable ,. . ,. . (.) .
Tax-exempt . . . . (.) .
Securities available for sale:
Taxable . . . . . .
Tax-exempt . (.) . . (.) .
Funds sold and securities purchased
under agreements to resell . . . (.) . .
Loans held for sale . . . (.) (.) (.)
Interest-bearing deposits . . . . (.) —
Trading assets . . . . . .
Total interest income ,. ,. ,. . . .
Interest Expense
NOW accounts . . . . . .
Money market accounts . . . . (.) (.)
Savings deposits (.) . . . . .
Consumer time deposits . . . . (.) (.)
Other time deposits . . . . . .
Brokered deposits . . . . (.) (.)
Foreign deposits . . . (.) . .
Funds purchased and securities sold
under agreements to repurchase . . . (.) . .
Other short-term borrowings . . . (.) . (.)
Long-term debt . . . . (.) .
Total interest expense . . ,. . (.) .
Net change in net interest income . . . . . .
Changes in net interest income are attributed to either changes in average balances (volume change) or changes in average rates (rate change) for earning assets and sources of funds on which interest is received or paid.
Volume change is calculated as change in volume times the previous rate, while rate change is change in rate times the previous volume. The rate/volume change, change in rate times change in volume, is allocated
between volume change and rate change at the ratio each component bears to the absolute value of their total.
Interest income includes the effects of taxable-equivalent adjustments (reduced by the nondeductible portion of interest expense) using a federal income tax rate of % and, where applicable, state income taxes to
increase tax-exempt interest income to a taxable-equivalent basis.