SunTrust 2005 Annual Report Download - page 35
Download and view the complete annual report
Please find page 35 of the 2005 SunTrust annual report below. You can navigate through the pages in the report by either clicking on the pages listed below, or by using the keyword search tool below to find specific information within the annual report.-
 1
1 -
2
-
3
-
4
-
5
-
6
-
7
-
8
-
9
-
10
-
11
-
12
-
13
-
14
-
15
-
16
-
17
-
18
-
19
-
20
-
21
-
22
-
23
-
24
-
 25
25 -
 26
26 -
 27
27 -
 28
28 -
 29
29 -
 30
30 -
 31
31 -
 32
32 -
 33
33 -
 34
34 -
 35
35 -
 36
36 -
 37
37 -
 38
38 -
 39
39 -
 40
40 -
 41
41 -
 42
42 -
 43
43 -
 44
44 -
 45
45 -
46
-
47
-
48
-
49
-
50
-
51
-
52
-
53
-
54
-
55
-
56
-
57
-
58
-
59
-
60
-
61
-
62
-
63
-
64
-
65
-
66
-
67
-
68
-
69
-
70
-
71
-
72
-
73
-
74
-
75
-
76
-
77
-
78
-
79
-
80
-
81
-
82
-
83
-
84
-
85
-
86
-
87
-
88
-
89
-
90
-
91
-
92
-
93
-
94
-
95
-
96
-
97
-
98
-
99
-
100
-
101
-
102
-
103
-
104
-
105
-
106
-
107
-
108
-
109
-
110
-
111
-
112
-
113
-
114
-
115
-
116
 |
 |

SUNTRUST ANNUAL REPORT 33
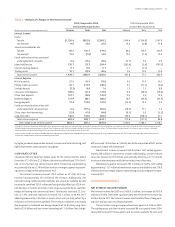
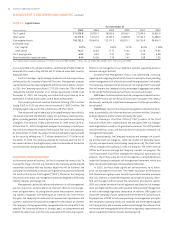
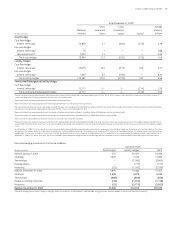
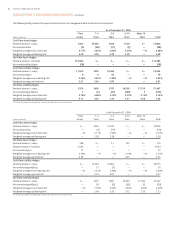
TABLE • Composition Of Average Deposits
Year Ended December Percent of Total
(Dollars in millions)
Noninterest bearing ,. ,. ,. .% .% .%
NOW accounts ,. ,. ,. . . .
Money market accounts ,. ,. ,. . . .
Savings ,. ,. ,. . . .
Consumer time ,. ,. ,. . . .
Other time ,. ,. ,. . . .
Total consumer and commercial deposits ,. ,. ,. . . .
Brokered deposits ,. ,. ,. . . .
Foreign deposits ,. ,. ,. . . .
Total deposits ,. ,. ,. .% .% .%
improved to .% compared to .% for . The average yield contin-
ued to improve to .% for the fourth quarter of . Given a relatively
flat yield curve and limited market opportunities, we shortened the esti-
mated average life of the portfolio to . years at December , from
. years at December , . Likewise, the portfolio’s average duration
shortened to . as of December , from . as of December ,
. Duration is a measure of the estimated price sensitivity of a bond
portfolio to an immediate change in interest rates. A duration of . sug-
gests an expected price change of .% for a one percent change in inter-
est rates, without considering any embedded call or prepayment options.
The size of the securities portfolio decreased . billion, or .%, to .
billion, or .%, of total assets at December , , down from .
billion, or .%, of total assets at December , . Consistent with
Asset/Liability Management Committee (“ALCO”) objectives, net securi-
ties losses of . million were realized during , primarily in the first
quarter, to improve future income by selling shorter duration securities
with lower yields and reinvesting in longer duration securities with higher
yields. Net securities losses realized for the year ended December ,
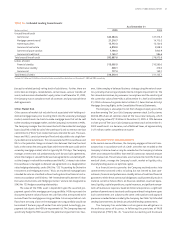
were . million. The current mix of securities as of December , is
shown in Table , Securities Available for Sale.
The carrying value of the investment portfolio, all of which is classi-
fied as securities available for sale, reflected . billion in net unrealized
gains at December , , including a . billion unrealized gain on the
Company’s investment in common stock of The Coca-Cola Company. The
net change in unrealized gain of this common stock investment decreased
. million, while the change in the net unrealized gain on the remainder
of the portfolio decreased . million compared to December , ,
reflecting the increase in market interest rates during . These changes
in market value did not affect the net income of SunTrust, but were included
in other comprehensive income. The Company reviews all of its securities
with unrealized losses for other than temporary impairment at least quar-
terly. As part of these reviews in , the Company determined that a
particular asset-backed security was impaired for other-than-temporary
reasons and recognized a security loss of . million. The Company has
determined that there were no additional other-than-temporary impair-
ments associated with securities as of December , .
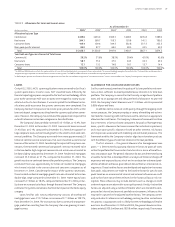
DEPOSITS
Average consumer and commercial deposits increased . billion, or
.%, in and comprised .%, .%, and .% of average total
deposits in , , and , respectively. The growth was primarily
due to the acquisition of NCF and initiatives to grow retail deposits. Time
deposit growth benefited from a marketing campaign that began in the first
quarter of and continued through the third quarter. Additionally, on
average, noninterest-bearing deposits grew . billion, or .%, NOW
accounts increased . billion, or .%, consumer time grew . bil-
lion, or .%, and money market accounts grew . billion, or .%,
compared to . The only deposit category to decline was savings, which
declined . million, or .%, as consumers took advantage of other
opportunities due to the rise in short-term interest rates.
Average brokered deposits increased . billion, or .%, and aver-
age foreign deposits increased . billion, or .%. The increase reflects
the funding required for earning asset growth that was in excess of the con-
sumer and commercial deposit growth.
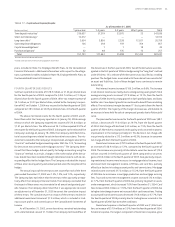
CAPITAL RESOURCES
The Company’s primary regulator, the Federal Reserve, measures capital
adequacy within a framework that makes capital requirements sensitive
to the risk profiles of individual banking companies. The guidelines weight
assets and off balance sheet risk exposures (risk weighted assets) according
to predefined classifications, creating a base from which to compare capi-
tal levels. Tier Capital primarily includes realized equity and qualified pre-
ferred instruments, less purchase accounting intangibles such as goodwill
and core deposit intangibles. Total Capital consists of Tier Capital and Tier
Capital, which includes qualifying portions of subordinated debt, allow-
ance for loan losses up to a maximum of .% of risk weighted assets, and
% of the unrealized gain on equity securities.
The Company and SunTrust Bank (the “Bank”) are subject to minimum
Tier Risk-Based Capital and Total Capital ratios of % and %, respec-
tively, of risk weighted assets. To be considered “well-capitalized,” ratios
of % and %, respectively, are needed. Additionally, the Company and
the Bank are subject to Tier Leverage ratio requirements, which measures
Tier Capital against average assets. The minimum and well-capitalized
ratios are % and %, respectively. As of December , , the Company
had Tier , Total Capital, and Tier Leverage ratios of .%, .% and
.%, respectively. This compares to ratios as of December , of
.%, .%, and .%, respectively. SunTrust is committed to remain-
ing well-capitalized.
In , the Company issued approximately . million shares of
SunTrust common stock with an aggregate value of approximately .
billion for the purchase of NCF. The remaining . billion of the purchase