Rogers 2008 Annual Report Download - page 80
Download and view the complete annual report
Please find page 80 of the 2008 Rogers annual report below. You can navigate through the pages in the report by either clicking on the pages listed below, or by using the keyword search tool below to find specific information within the annual report.-
 1
1 -
2
-
3
-
4
-
5
-
6
-
7
-
8
-
9
-
10
-
11
-
12
-
13
-
14
-
15
-
16
-
17
-
18
-
19
-
20
-
21
-
22
-
23
-
24
-
25
-
26
-
27
-
28
-
29
-
30
-
31
-
32
-
33
-
34
-
35
-
36
-
37
-
38
-
39
-
40
-
41
-
42
-
43
-
44
-
45
-
46
-
47
-
48
-
49
-
50
-
51
-
52
-
53
-
54
-
55
-
56
-
57
-
58
-
59
-
60
-
61
-
62
-
63
-
64
-
65
-
66
-
67
-
68
-
69
-
 70
70 -
 71
71 -
 72
72 -
 73
73 -
 74
74 -
 75
75 -
 76
76 -
 77
77 -
 78
78 -
 79
79 -
 80
80 -
 81
81 -
 82
82 -
 83
83 -
 84
84 -
 85
85 -
 86
86 -
 87
87 -
 88
88 -
 89
89 -
 90
90 -
91
-
92
-
93
-
94
-
95
-
96
-
97
-
98
-
99
-
100
-
101
-
102
-
103
-
104
-
105
-
106
-
107
-
108
-
109
-
110
-
111
-
112
-
113
-
114
-
115
-
116
-
117
-
118
-
119
-
120
-
121
-
122
-
123
-
124
-
125
-
126
-
127
-
128
-
129
-
130
-
131
-
132
-
133
-
134
-
135
-
136
 |
 |

76 ROGERS COMMUNICATIONS INC. 2008 ANNUAL REPORT
MANAGEMENT’S DISCUSSION AND ANALYSIS OF FINANCIAL CONDITION AND RESULTS OF OPERATIONS
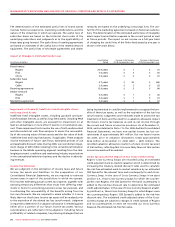
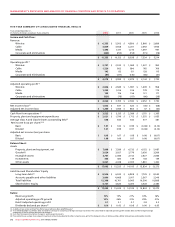
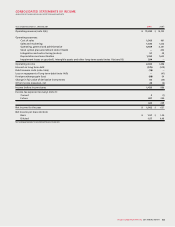
QUARTERLY CONSOLIDATED FINANCIAL SUMMARY
(In millions of dollars, 2008 2007
except per share amounts) Q1 Q2 Q3 Q4 Q1 Q2 Q3 Q4
Income Statement
Operating Revenue
Wireless $ 1,431 $ 1,522 $ 1,727 $ 1,655 $ 1,231 $ 1,364 $ 1,442 $ 1,466
Cable 925 938 961 985 855 881 899 923
Media 307 409 386 394 266 348 339 364
Corporate and eliminations (54) (66) (92) (93) (54) (66) (69) (66)
2,609 2,803 2,982 2,941 2,298 2,527 2,611 2,687
Operating profit before the undernoted
Wireless 705 769 693 639 581 664 686 658
Cable 303 304 318 313 228 243 265 265
Media 2 52 43 46 19 45 46 63
Corporate and eliminations (26) (36) (29) (30) (14) (22) (13) (29)
984 1,089 1,025 968 814 930 984 957
Stock option plan amendment (1) – – – – – (452) – –
Stock-based compensation recovery
(expense)
(1) 116 (53) 62 (25) (15) (32) (11) (4)
Integration and restructuring
expenses
(2) (5) (3) (2) (41) (1) (15) (5) (17)
Adjustment for CRTC Part II
fees decision (3) – (37) – – – – 18 –
Contract renegotiation fee(4) – – – – – – – (52)
Operating profit(5) 1,095 996 1,085 902 798 431 986 884
Depreciation and amortization 440 420 429 471 400 398 397 408
Impairment losses on goodwill,
intangible assets and
other long-term assets(6) – – – 294 – – – –
Operating income 655 576 656 137 398 33 589 476
Interest on long-term debt (138) (133) (147) (157) (149) (152) (140) (138)
Other income (expense) (3) 11 – (31) 7 (24) (14) –
Income tax reduction (expense) (170) (153) (14) (87) (86) 87 (166) (84)
Net income (loss) for the period $ 344 $ 301 $ 495 $ (138) $ 170 $ (56) $ 269 $ 254
Net income (loss) per share:
Basic $ 0.54 $ 0.47 $ 0.78 $ (0.22) $ 0.27 $ (0.09) $ 0.42 $ 0.40
Diluted $ 0.54 $ 0.47 $ 0.78 $ (0.22) $ 0.26 $ (0.09) $ 0.42 $ 0.40
Additions to property, plant
and equipment(5) $ 321 $ 481 $ 436 $ 783 $ 394 $ 381 $ 397 $ 624
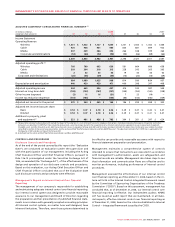
(1) See section entitled “Stock-based Compensation”.
(2) Costs incurred relate to severances resulting from the restructuring of our employee base to improve our cost structure in light of the declining economic conditions, the integration of Call-Net, Futureway
and Aurora Cable, the restructuring of Rogers Business Solutions (“RBS”), and the closure of certain Rogers Retail stores.
(3) Related to an adjustment of CRTC Part II fees related to prior periods. See the section entitled “Government Regulation and Regulatory Developments”.
(4) One-time charge resulting from the renegotiation of an Internet-related services agreement.
(5) As defined. See the section entitled “Key Performance Indicators and Non-GAAP Measures”.
(6) In the fourth quarter of 2008, we determined that the fair value of the conventional television business of Media was lower than its carrying value. This primarily resulted from weakening of industry
expectations and declines in advertising revenues amidst the slowing economy. As a result, we recorded an aggregate non-cash impairment charge of $294 million with the following components:
$154 million related to goodwill, $75 million related to broadcast licences and $65 million related to intangible assets and other long-term assets.