Rogers 2008 Annual Report Download - page 40
Download and view the complete annual report
Please find page 40 of the 2008 Rogers annual report below. You can navigate through the pages in the report by either clicking on the pages listed below, or by using the keyword search tool below to find specific information within the annual report.-
 1
1 -
2
-
3
-
4
-
5
-
6
-
7
-
8
-
9
-
10
-
11
-
12
-
13
-
14
-
15
-
16
-
17
-
18
-
19
-
20
-
21
-
22
-
23
-
24
-
25
-
26
-
27
-
28
-
29
-
 30
30 -
 31
31 -
 32
32 -
 33
33 -
 34
34 -
 35
35 -
 36
36 -
 37
37 -
 38
38 -
 39
39 -
 40
40 -
 41
41 -
 42
42 -
 43
43 -
 44
44 -
 45
45 -
 46
46 -
 47
47 -
 48
48 -
 49
49 -
 50
50 -
51
-
52
-
53
-
54
-
55
-
56
-
57
-
58
-
59
-
60
-
61
-
62
-
63
-
64
-
65
-
66
-
67
-
68
-
69
-
70
-
71
-
72
-
73
-
74
-
75
-
76
-
77
-
78
-
79
-
80
-
81
-
82
-
83
-
84
-
85
-
86
-
87
-
88
-
89
-
90
-
91
-
92
-
93
-
94
-
95
-
96
-
97
-
98
-
99
-
100
-
101
-
102
-
103
-
104
-
105
-
106
-
107
-
108
-
109
-
110
-
111
-
112
-
113
-
114
-
115
-
116
-
117
-
118
-
119
-
120
-
121
-
122
-
123
-
124
-
125
-
126
-
127
-
128
-
129
-
130
-
131
-
132
-
133
-
134
-
135
-
136
 |
 |
36 ROGERS COMMUNICATIONS INC. 2008 ANNUAL REPORT
MANAGEMENT’S DISCUSSION AND ANALYSIS OF FINANCIAL CONDITION AND RESULTS OF OPERATIONS
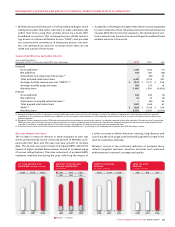
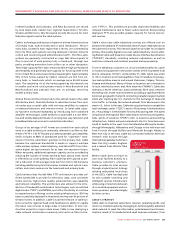
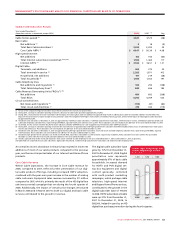
During 200 8 , wireles s data
revenue increased by approxi-
mately 39% over 2007, to $946
million. This increase in data
revenue reflects the continued
growth of smartphone and air
card devices which is driving the
use of texts and e-mail, wireless
Internet access, and other wire-
less data services, partially offset
by the impact of certain data
services price reductions made
in the third quarter of 2008. In
2008, data revenue represented
approximately 16% of total net-
work revenue, compared to 13%
in 2007.
Wireless Equipment Sales
The year-over-year increase in revenue from equipment sales,
including activation fees and net of equipment subsidies, reflects
the large volume of smartphones sold during 2008.
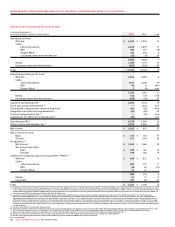
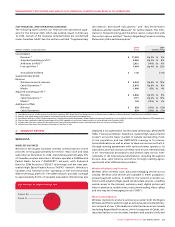
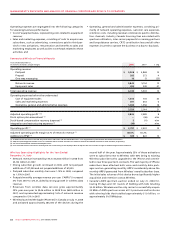
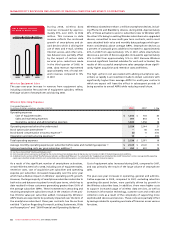
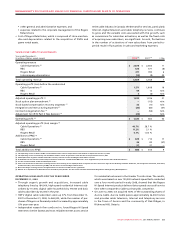
Wireless Operating Expenses
Years ended December 31,
(In millions of dollars, except per subscriber statistics) 2008 2007 % Chg
Operating expenses
Cost of equipment sales $ 1,005 $ 703 43
Sales and marketing expenses 691 653 6
Operating, general and administrative expenses 1,833 1,558 18
Operating expenses before the undernoted 3,529 2,914 21
Stock option plan amendment (1) – 46 n/m
Stock-based compensation (recovery) expense (1) (5) 11 n/m
Integration and restructuring expenses (2) 14 – n/m
Total operating expenses $ 3,538 $ 2,971 19
Average monthly operating expense per subscriber before sales and marketing expenses (3) $ 23.09 $ 20.61 12
Sales and marketing costs per gross subscriber addition (3) $ 459 $ 401 14
(1) See the section entitled “Stock-based Compensation”.
(2) Costs incurred relate to severances resulting from the restructuring of our employee base to improve our cost structure in light of the declining economic conditions.
(3) As defined. See the section entitled “Key Performance Indicators and Non-GAAP Measures”. As calculated in the “Supplementary Information: Non-GAAP Calculations” section. Average monthly operating
expense per subscriber includes retention costs and excludes sales and marketing expenses and stock-based compensation (recovery) expense.
Wireless activated more than 1.2 million smartphone devices, includ-
ing iPhone 3G and BlackBerry devices, during 2008. Approximately
43% of these activations were to subscribers new to Wireless with
the other 57% being to existing Wireless subscribers who upgraded
devices, committed to new multi-year term contracts, and in most
cases attached both voice and monthly data packages which gen-
erate considerably above average ARPU. Smartphone devices as
a percent of postpaid gross additions increased to approximately
40% in 2008 from approximately 13% in 2007, while smartphone
devices as a percent of device upgrades increased to approximately
41% in 2008 from approximately 12% in 2007. Because Wireless
incurred significant handset subsidies for each unit activated, the
results of this successful smartphone sales campaign drove signifi-
cantly higher acquisition and retention costs at Wireless.
The high upfront cost associated with adding smartphone sub-
scribers so rapidly is an investment made to obtain customers with
significantly higher than average ARPU for multi-year contracts
which we expect will have the effect in subsequent periods of
being accretive to overall ARPU while reducing overall churn.
As a result of the significant number of smartphone activations,
certain Wireless metrics for 2008, including cost of equipment sales,
retention costs, cost of acquisition per subscriber and operating
expense per subscriber, increased measurably over the prior year
which had a dilutive impact on Wireless’ operating profit growth.
However, the large majority of smartphone subscribers subscribe to
both voice and data service plans for multi-year terms, which has to
date resulted in these customers generating greater than 150% of
the average subscriber ARPU. These investments in attracting and
retaining smartphone subscribers result in the creation of net posi-
tive lifetime value per subscriber added. Consequently, Wireless’
ARPU levels are expected to be positively impacted over the term of
the smartphone subscribers’ three year contracts. See the sections
entitled “Caution Regarding Forward-Looking Statements, Risks
and Assumptions” and “2009 Financial and Operating Guidance”.
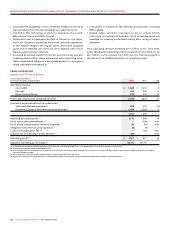
Cost of equipment sales increased during 2008, compared to 2007,
and was primarily the result of the large volume of smartphone
sales.
The year-over-year increases in operating, general and adminis-
trative expenses in 2008, compared to 2007, excluding retention
spending discussed below, were partially driven by growth in
the Wireless subscriber base. In addition, there were higher costs
to support increased usage of wireless data services, as well as
increases in information technology, customer care and credit and
collection costs as a result of the complexity of supporting more
sophisticated devices and services. These costs were partially offset
by savings related to operating and scale efficiencies across various
functions.
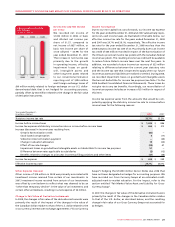
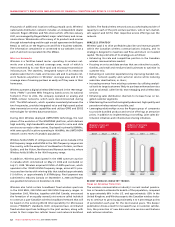
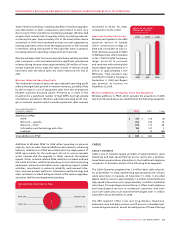
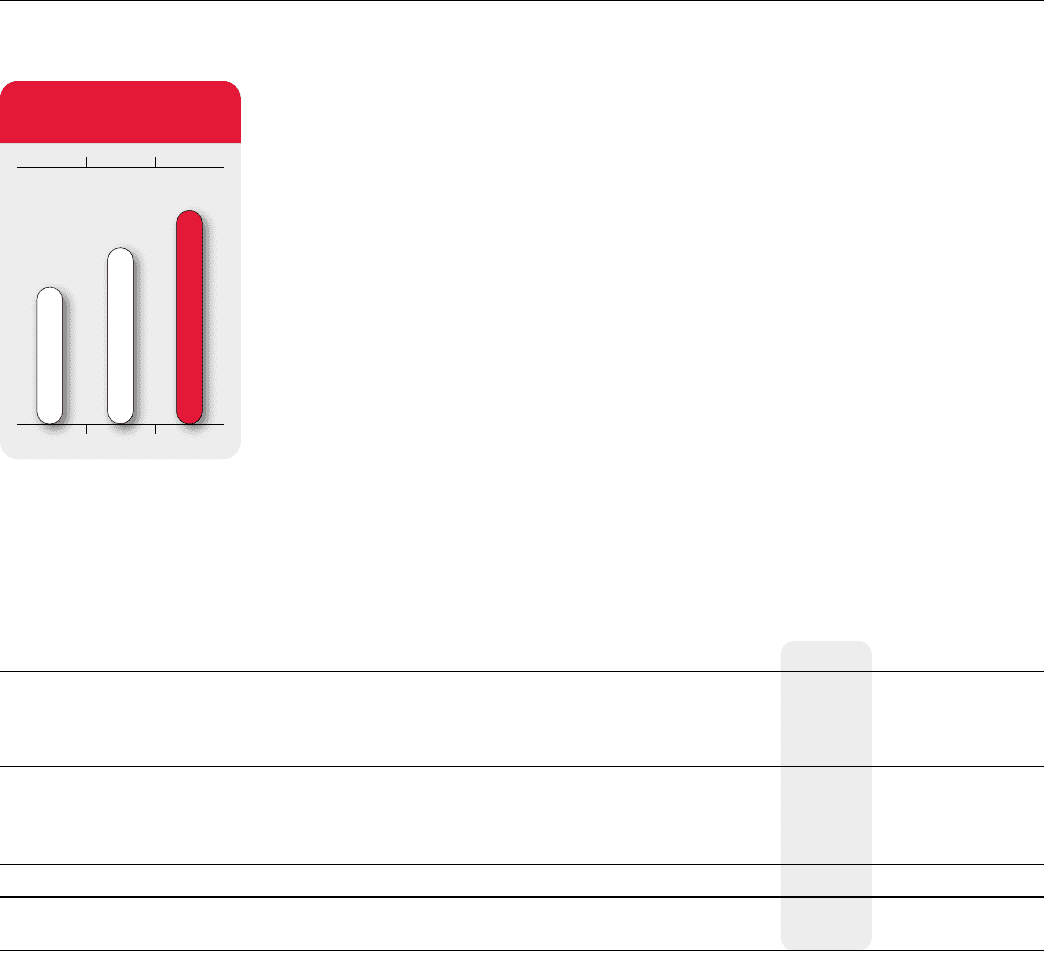
20082007
17.5%14.4%11.2%
DATA REVENUE PERCENT
OF ARPU (at end of year)
(%)
2006