Rogers 2008 Annual Report Download - page 71
Download and view the complete annual report
Please find page 71 of the 2008 Rogers annual report below. You can navigate through the pages in the report by either clicking on the pages listed below, or by using the keyword search tool below to find specific information within the annual report.-
 1
1 -
2
-
3
-
4
-
5
-
6
-
7
-
8
-
9
-
10
-
11
-
12
-
13
-
14
-
15
-
16
-
17
-
18
-
19
-
20
-
21
-
22
-
23
-
24
-
25
-
26
-
27
-
28
-
29
-
30
-
31
-
32
-
33
-
34
-
35
-
36
-
37
-
38
-
39
-
40
-
41
-
42
-
43
-
44
-
45
-
46
-
47
-
48
-
49
-
50
-
51
-
52
-
53
-
54
-
55
-
56
-
57
-
58
-
59
-
60
-
 61
61 -
 62
62 -
 63
63 -
 64
64 -
 65
65 -
 66
66 -
 67
67 -
 68
68 -
 69
69 -
 70
70 -
 71
71 -
 72
72 -
 73
73 -
 74
74 -
 75
75 -
 76
76 -
 77
77 -
 78
78 -
 79
79 -
 80
80 -
 81
81 -
82
-
83
-
84
-
85
-
86
-
87
-
88
-
89
-
90
-
91
-
92
-
93
-
94
-
95
-
96
-
97
-
98
-
99
-
100
-
101
-
102
-
103
-
104
-
105
-
106
-
107
-
108
-
109
-
110
-
111
-
112
-
113
-
114
-
115
-
116
-
117
-
118
-
119
-
120
-
121
-
122
-
123
-
124
-
125
-
126
-
127
-
128
-
129
-
130
-
131
-
132
-
133
-
134
-
135
-
136
 |
 |

ROGERS COMMUNICATIONS INC. 2008 ANNUAL REPORT 67
MANAGEMENT’S DISCUSSION AND ANALYSIS OF FINANCIAL CONDITION AND RESULTS OF OPERATIONS
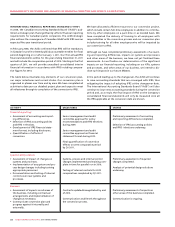
• Sales and marketing expenses, which represent the costs to
acquire new subscribers (other than those related to equipment),
such as advertising, commissions paid to third parties for new
activations, remuneration and benefits to sales and marketing
employees, as well as direct overheads related to these activities
and the costs of operating the Rogers Retail store locations; and
• Operating,generalandadministrativeexpenses,whichinclude
all other expenses incurred to operate the business on a day-to-
day basis and service existing subscriber relationships, including
retention costs, inter-carrier payments to roaming partners and
long-distance carriers, network maintenance costs, program-
ming related costs, the CRTC contribution levy, Internet and
e-mail services and printing and production cost.
In the wireless and cable industries in Canada, the demand for ser-
vices continues to grow and the variable costs, such as commissions
paid for subscriber activations, as well as the fixed costs of acquir-
ing new subscribers, are significant. Fluctuations in the number of
activations of new subscribers from period-to-period and the sea-
sonal nature of both wireless and cable subscriber additions result
in fluctuations in sales and marketing expenses and accordingly, in
the overall level of operating expenses. In our Media business, sales
and marketing expenses may be significant to promote publishing,
radio and television properties, which in turn attract advertisers,
viewers, listeners and readers.
Sales and Marketing Costs (or Cost of Acquisition)
Per Subscriber
Sales and marketing costs per subscriber, which is also often referred
to in the Wireless industry as cost of acquisition per subscriber
(“COA”), “subscriber acquisition cost”, or “cost per gross addition”,
is calculated by dividing total sales and marketing expenditures,
plus costs related to equipment provided to new subscribers for
the period, by the total number of gross subscriber activations dur-
ing the period. Subscriber activations include postpaid and prepaid
voice and data activations and one-way messaging activations.
COA, as it relates to a particular activation, can vary depending
on the level of ARPU and term of a subscriber’s contract. Refer
to the section entitled “Supplementary Information: Non-GAAP
Calculations” for further details on the calculation.
The wireless communications industry in Canada continues to grow
and the costs of acquiring new subscribers are significant. Because
a substantial portion of subscriber activation costs are variable in
nature, such as commissions paid for each new activation, and due to
fluctuations in the number of activations of new subscribers from peri-
od-to-period and the seasonal nature of these subscriber additions,
we experience material fluctuations in sales and marketing expenses
and, accordingly, in the overall level of operating expenses.
Operating Expense per Subscriber
Operating expense per subscriber, expressed as a monthly average,
is calculated by dividing total operating, general and administrative
expenses, plus costs related to equipment provided to existing sub-
scribers, by the average number of subscribers during the period.
Operating expense per subscriber is tracked by Wireless as a mea-
sure of our ability to leverage our operating cost structure across
a growing subscriber base, and we believe that it is an impor-
tant measure of our ability to achieve the benefits of scale as we
increase the size of our business. Refer to the section entitled
“Supplementary Information: Non-GAAP Calculations” for further
details on this Wireless calculation.
Operating Profit and Operating Profit Margin
We define operating profit as net income before depreciation and
amortization, interest expense, income taxes and non-operating
items, which include impairment losses on goodwill, intangible
assets and other long-term assets, foreign exchange gains (losses),
loss on repayment of long-term debt, change in fair value of deriv-
ative instruments, and other income. Operating profit is a standard
measure used in the communications industry to assist in under-
standing and comparing operating results and is often referred to
by our peers and competitors as EBITDA (earnings before interest,
taxes, depreciation and amortization) or OIBDA (operating income
before depreciation and amortization). We believe this is an impor-
tant measure as it allows us to assess our ongoing businesses
without the impact of depreciation or amortization expenses as
well as non-operating factors. It is intended to indicate our ability
to incur or service debt, invest in PP&E and allows us to compare
us to our peers and competitors who may have different capital or
organizational structures. This measure is not a defined term under
Canadian GAAP or U.S. GAAP.
We calculate operating profit margin by dividing operating profit
by total revenue, except in the case of Wireless. For Wireless,
operating profit margin is calculated by dividing operating profit
by network revenue. Network revenue is used in the calculation,
instead of total revenue, because network revenue better reflects
Wireless’ core business activity of providing wireless services. Refer
to the section entitled “Supplementary Information: Non-GAAP
Calculations” for further details on this Wireless, Cable and Media
calculation.
Adjusted Operating Profit, Adjusted Operating Profit Margin,
Adjusted Net Income, and Adjusted Basic and Diluted Net
Income Per Share
Beginning in 2007, we have included certain non-GAAP measures
that we believe provide useful information to management and
readers of this MD&A in measuring our financial performance.
These measures, which include adjusted operating profit, adjusted
operating profit margin, adjusted net income and adjusted basic
and diluted net income per share, do not have a standardized mean-
ing under GAAP and, therefore, may not be comparable to similarly
titled measures presented by other publicly traded companies, nor
should they be construed as an alternative to other financial mea-
sures determined in accordance with GAAP. We define adjusted
operating profit as operating profit less: (i) the impact of the one-
time non-cash charge resulting from the introduction of a cash
settlement feature related to employee stock options; (ii) stock-
based compensation expense; (iii) integration and restructuring
expenses; (iv) the impact of a one-time charge resulting from the
renegotiation of an Internet-related services agreement; and (v) an
adjustment for Canadian Radio-television and Telecommunications
Commission (“CRTC”) Part II fees related to prior periods. In addi-
tion, adjusted net income and net income per share excludes debt
issuance costs, losses on repayment of long-term debt, impairment
losses on goodwill, intangible assets and other long-term assets,
and the related income tax impacts of the above items.