Rogers 2008 Annual Report Download - page 41
Download and view the complete annual report
Please find page 41 of the 2008 Rogers annual report below. You can navigate through the pages in the report by either clicking on the pages listed below, or by using the keyword search tool below to find specific information within the annual report.-
 1
1 -
2
-
3
-
4
-
5
-
6
-
7
-
8
-
9
-
10
-
11
-
12
-
13
-
14
-
15
-
16
-
17
-
18
-
19
-
20
-
21
-
22
-
23
-
24
-
25
-
26
-
27
-
28
-
29
-
30
-
 31
31 -
 32
32 -
 33
33 -
 34
34 -
 35
35 -
 36
36 -
 37
37 -
 38
38 -
 39
39 -
 40
40 -
 41
41 -
 42
42 -
 43
43 -
 44
44 -
 45
45 -
 46
46 -
 47
47 -
 48
48 -
 49
49 -
 50
50 -
 51
51 -
52
-
53
-
54
-
55
-
56
-
57
-
58
-
59
-
60
-
61
-
62
-
63
-
64
-
65
-
66
-
67
-
68
-
69
-
70
-
71
-
72
-
73
-
74
-
75
-
76
-
77
-
78
-
79
-
80
-
81
-
82
-
83
-
84
-
85
-
86
-
87
-
88
-
89
-
90
-
91
-
92
-
93
-
94
-
95
-
96
-
97
-
98
-
99
-
100
-
101
-
102
-
103
-
104
-
105
-
106
-
107
-
108
-
109
-
110
-
111
-
112
-
113
-
114
-
115
-
116
-
117
-
118
-
119
-
120
-
121
-
122
-
123
-
124
-
125
-
126
-
127
-
128
-
129
-
130
-
131
-
132
-
133
-
134
-
135
-
136
 |
 |

ROGERS COMMUNICATIONS INC. 2008 ANNUAL REPORT 37
MANAGEMENT’S DISCUSSION AND ANALYSIS OF FINANCIAL CONDITION AND RESULTS OF OPERATIONS
Total retention spending, including subsidies on handset upgrades,
was $536 million in 2008, compared to $403 million in 2007. As a
direct result of the smartphone marketing campaign, Wireless had
a higher than normal rate of upgrade activity by existing subscrib-
ers during the year. Approximately 57% of the smartphone device
activations in 2008 were hardware and service plan upgrades by
existing subscribers which drove the largest portion of the increase
in retention, along with growth in the subscriber base, in general,
increasing retention spending compared to prior periods.
Wireless estimates that the incremental hardware subsidy and data
plan commission costs associated with the significant smartphone
volumes during the year drove approximately $200 million of incre-
mental expenses versus what the same volume of devices would
have been with the device sales mix which existed at the end of
20 07.
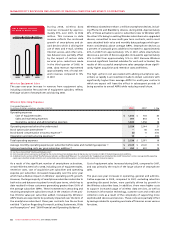
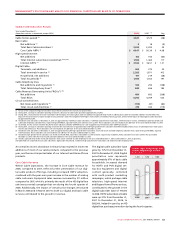
Wireless Adjusted Operating Profit
The moderate increase in year-over-year adjusted operating profit
reflects the significant growth in network revenues, partially offset
by the increase in cost of equipment sales from the smartphone
handset subsidies discussed above. Primarily as a result of the
investment in a significant number of high ARPU, but high subsidy
smartphone activations, Wireless’ adjusted operating profit mar-
gin on network revenue (which excludes equipment sales revenue)
decreased to 48.0% for 2008,
compared to 50.2% in 2007.
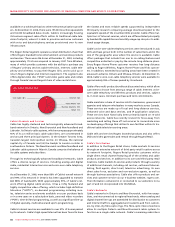
Spectrum Auction Conclusion
Wireless participated in the AWS
spectrum auction in Canada
which commenced on May 27,
2008 and concluded on July 21,
2008. Wireless acquired 20 MHz
of AWS spectrum, which operates
in the 1700/2100 MHz frequency
range, across all 13 provinces
and territories with winning bids
that totalled approximately $1.0
billion, or approximately $1.67/
MHz/pop. Final payment was
submitted to Industry Canada on
September 3, 2008 and Rogers
was granted its licences on
December 22, 2008.
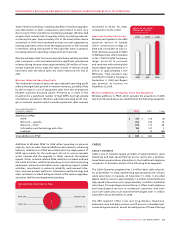
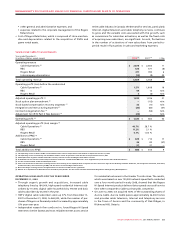
Wireless Additions to Property, Plant and Equipment
Wireless additions to PP&E, which excludes the acquisition of AWS
spectrum discussed above, are classified into the following categories:
20082007
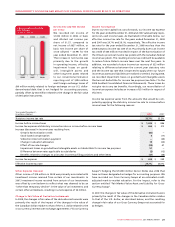
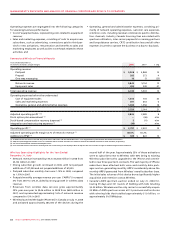
$2,806$2,589$1,987
WIRELESS ADJUSTED
OPERATING PROFIT
(In millions of dollars)
2007
2008
2006
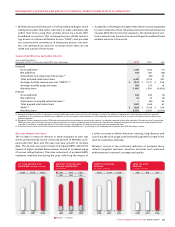
2008 WIRELESS ADDITIONS TO PP&E
(%)
HSPA 34%
Other 16%
Inukshuk 1%
Network 49%
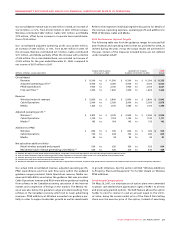
Years ended December 31,
(In millions of dollars) 2008 2007 % Chg
Additions to PP&E
HSPA $ 315 $ 316 (0)
Network – capacity 200 169 18
Network – other 259 175 48
Information and technology and other 152 147 3
Inukshuk 3 15 (80)
Total additions to PP&E $ 929 $ 822 13
Additions to Wireless PP&E for 2008 reflect spending on network
capacity, such as radio channel additions and network enhancing
features. Additions to PP&E associated with the deployment of
HSPA were mainly for the continued roll-out to various markets
across Canada and the upgrade to faster network throughput
speeds. Other network-related PP&E additions included national
site build activities, additional spending on test and monitoring
equipment, network sectorization work, operating support system
activities, investments in network reliability and renewal initia-
tives, and new product platforms. Information and technology and
other initiatives included billing and back office system upgrades,
and other facilities and equipment spending.
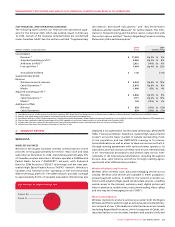
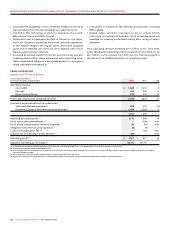
CABLE
CABLE’S BUSINESS
Cable is one of Canada’s largest providers of cable television, cable
telephony and high-speed Internet access, and is also a facilities-
based telecommunications alternative to the traditional telephone
companies. Its business consists of the following three segments:
The Cable Operations segment has 2.3 million basic cable subscrib-
ers at December 31, 2008, representing approximately 30% of basic
cable subscribers in Canada. At December 31, 2008, it provided
digital cable services to approximately 1.6 million households and
high-speed Internet service to approximately 1.6 million residential
subscribers. Through Rogers Home Phone, it offers local telephone
and long-distance services to residential customers with both
voice-over-cable and circuit-switched technologies with 1.1 million
subscriber lines at December 31, 2008.
The RBS segment offers local and long-distance telephone,
enhanced voice and data services, and IP access to Canadian busi-
nesses and governments, as well as making some of these offerings