Rogers 2008 Annual Report Download - page 47
Download and view the complete annual report
Please find page 47 of the 2008 Rogers annual report below. You can navigate through the pages in the report by either clicking on the pages listed below, or by using the keyword search tool below to find specific information within the annual report.-
 1
1 -
2
-
3
-
4
-
5
-
6
-
7
-
8
-
9
-
10
-
11
-
12
-
13
-
14
-
15
-
16
-
17
-
18
-
19
-
20
-
21
-
22
-
23
-
24
-
25
-
26
-
27
-
28
-
29
-
30
-
31
-
32
-
33
-
34
-
35
-
36
-
 37
37 -
 38
38 -
 39
39 -
 40
40 -
 41
41 -
 42
42 -
 43
43 -
 44
44 -
 45
45 -
 46
46 -
 47
47 -
 48
48 -
 49
49 -
 50
50 -
 51
51 -
 52
52 -
 53
53 -
 54
54 -
 55
55 -
 56
56 -
 57
57 -
58
-
59
-
60
-
61
-
62
-
63
-
64
-
65
-
66
-
67
-
68
-
69
-
70
-
71
-
72
-
73
-
74
-
75
-
76
-
77
-
78
-
79
-
80
-
81
-
82
-
83
-
84
-
85
-
86
-
87
-
88
-
89
-
90
-
91
-
92
-
93
-
94
-
95
-
96
-
97
-
98
-
99
-
100
-
101
-
102
-
103
-
104
-
105
-
106
-
107
-
108
-
109
-
110
-
111
-
112
-
113
-
114
-
115
-
116
-
117
-
118
-
119
-
120
-
121
-
122
-
123
-
124
-
125
-
126
-
127
-
128
-
129
-
130
-
131
-
132
-
133
-
134
-
135
-
136
 |
 |

ROGERS COMMUNICATIONS INC. 2008 ANNUAL REPORT 43
MANAGEMENT’S DISCUSSION AND ANALYSIS OF FINANCIAL CONDITION AND RESULTS OF OPERATIONS
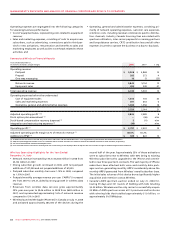
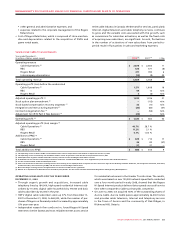
Summarized Subscriber Results
Years ended December 31,
(Subscriber statistics in thousands, except ARPU) 2008 2007 (1) Chg
Cable homes passed (2) 3,547 3,575 (28)
Basic Cable
Net additions (3) 9 18 (9)
Total Basic Cable subscribers (4) 2,320 2,295 25
Core Cable ARPU (5) $ 60.47 $ 56.39 $ 4.08
High-speed Internet
Net additions 102 165 (63)
Total Internet subscribers (residential) (4)(6)(7)(8) 1,582 1,465 117
Internet ARPU (5) $ 37.82 $ 36.51 $ 1.31
Digital Cable
Terminals, net additions 404 374 30
Total terminals in service (4) 2,283 1,871 412
Households, net additions 191 219 (28)
Total households (4) 1,550 1,353 197
Cable telephony lines
Net additions and migrations (9) 182 290 (108)
Total Cable telephony lines (4) 840 656 184
Cable Revenue Generating Units (“RGUs”) (10)
Net additions 484 692 (208)
Total RGUs 6,292 5,769 523
Circuit-switched lines
Net losses and migrations (9) (119) (37) (82)
Total circuit-switched lines (7) 215 334 (119)
(1) Certain of the comparative figures have been reclassified to conform to the current year presentation.
(2) During 2008, a change in subscriber reporting resulted in a decrease to cable homes passed of approximately 150,000.
(3) During 2008, a reclassification of certain subscribers had the impact of increasing basic cable net additions by approximately 16,000. In addition, basic cable net subscriber additions for 2008 reflect the
impact of the conversion of a large municipal housing authority’s cable TV arrangement with Rogers from a bulk to an individual tenant pay basis, which had the impact of reducing basic cable subscribers
by approximately 5,000.
(4) Included in total subscribers at December 31, 2008 are approximately 16,000 basic cable subscribers, 11,000 high-speed Internet subscribers, 8,000 terminals in service, 6,000 digital cable households and
2,000 cable telephony subscriber lines, representing 35,000 RGUs, acquired from Aurora Cable on June 12, 2008. These subscribers are not included in net additions for the year ended December 31, 2008.
(5) As defined. See the sections entitled “Key Performance Indicators and Non-GAAP Measures” and “Supplementary Information: Non-GAAP Calculations”.
(6) During 2008, a change in subscriber reporting resulted in the reclassification of approximately 4,000 high-speed Internet subscribers from RBS’ broadband data circuits to Cable Operations’ high-speed
Internet subscriber base. These subscribers are not included in net additions for the year ended December 31, 2008.
(7) Included in total subscribers at December 31, 2007 are approximately 3,000 high-speed Internet subscribers and 21,000 circuit-switched telephony subscriber lines, representing 24,000 RGUs, acquired
from Futureway. These subscribers are not included in net additions for the year ended December 31, 2007.
(8) Included in high-speed Internet subscribers are 10,000 and 14,000 ADSL subscribers at December 31, 2008 and 2007, respectively. In addition, ADSL subscriber losses were 3,000 in the year ended
December 31, 2008, while there were 8,000 subscriber additions in the year ended December 31, 2007.
(9) Includes approximately 60,000 and 42,000 migrations from circuit-switched to cable telephony for the years ended December 31, 2008 and December 31, 2007, respectively.
(10) Cable RGUs are comprised of basic cable subscribers, digital cable households, residential high-speed Internet subscribers and residential cable telephony lines.
An overall economic slowdown in Ontario has resulted in lower net
additions of most of our cable products compared to the previous
year, and has most impacted sales of our Internet and Home Phone
products.
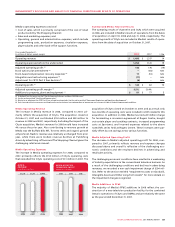
Core Cable Revenue
Within Cable Operations, the increase in Core Cable revenue for
2008, compared to 2007, reflects further penetration of our digi-
tal cable product offerings, including increased HDTV adoption,
combined with the year-over-year increase in the number of analog
cable customers. Equipment sales revenue increased by $11 million
compared to 2007, which is primarily the result of the HD digital box
sale (versus rental) campaign that ran during the fourth quarter of
2008. Additionally, the impact of certain price changes introduced
in March 2008 and in March 2007 to both our digital and basic cable
services contributed to the growth in revenue.
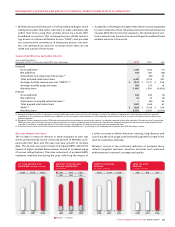
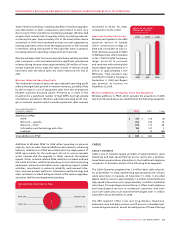
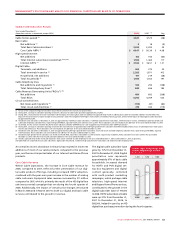
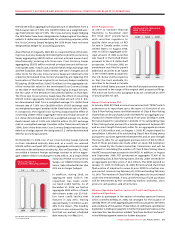
The digital cable subscriber base
grew by 15% from December 31,
2007 to December 31, 2008. Digital
penetration now represents
approximately 67% of basic cable
households. Increased demand
for HDTV and PVR digital set-
top box equipment and digital
content generally, combined
with multi-product marketing
campaigns, which package cable
television, high-speed Internet
and Rogers Home Phone services,
contributed to the growth in the
digital subscriber base of 197,000
in 2008. HDTV subscribers at Cable
were up 37% from December 31,
2007 to December 31, 2008, to
568,000, helped in part by an HD
digital box purchase promotion during the fourth quarter.
20082007
1,5501,3531,134
DIGITAL CABLE HOUSEHOLDS AND
DIGITAL PENETRATION OF BASIC
(In thousands)
2007
2008
2006
67%
59%
50%