Rogers 2008 Annual Report Download - page 38
Download and view the complete annual report
Please find page 38 of the 2008 Rogers annual report below. You can navigate through the pages in the report by either clicking on the pages listed below, or by using the keyword search tool below to find specific information within the annual report.-
 1
1 -
2
-
3
-
4
-
5
-
6
-
7
-
8
-
9
-
10
-
11
-
12
-
13
-
14
-
15
-
16
-
17
-
18
-
19
-
20
-
21
-
22
-
23
-
24
-
25
-
26
-
27
-
 28
28 -
 29
29 -
 30
30 -
 31
31 -
 32
32 -
 33
33 -
 34
34 -
 35
35 -
 36
36 -
 37
37 -
 38
38 -
 39
39 -
 40
40 -
 41
41 -
 42
42 -
 43
43 -
 44
44 -
 45
45 -
 46
46 -
 47
47 -
 48
48 -
49
-
50
-
51
-
52
-
53
-
54
-
55
-
56
-
57
-
58
-
59
-
60
-
61
-
62
-
63
-
64
-
65
-
66
-
67
-
68
-
69
-
70
-
71
-
72
-
73
-
74
-
75
-
76
-
77
-
78
-
79
-
80
-
81
-
82
-
83
-
84
-
85
-
86
-
87
-
88
-
89
-
90
-
91
-
92
-
93
-
94
-
95
-
96
-
97
-
98
-
99
-
100
-
101
-
102
-
103
-
104
-
105
-
106
-
107
-
108
-
109
-
110
-
111
-
112
-
113
-
114
-
115
-
116
-
117
-
118
-
119
-
120
-
121
-
122
-
123
-
124
-
125
-
126
-
127
-
128
-
129
-
130
-
131
-
132
-
133
-
134
-
135
-
136
 |
 |

34 ROGERS COMMUNICATIONS INC. 2008 ANNUAL REPORT
MANAGEMENT’S DISCUSSION AND ANALYSIS OF FINANCIAL CONDITION AND RESULTS OF OPERATIONS
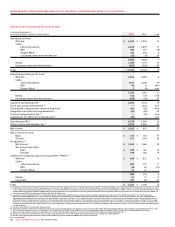
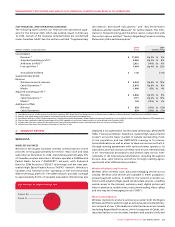
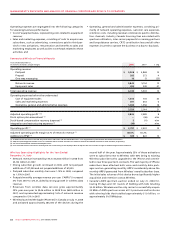
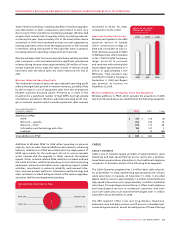
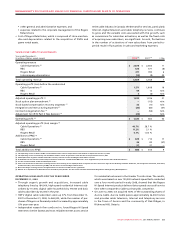
Summarized Wireless Financial Results
Years ended December 31,
(In millions of dollars, except margin) 2008 2007 % Chg
Operating revenue
Postpaid $ 5,548 $ 4,868 14
Prepaid 285 273 4
One-way messaging 10 13 (23)
Network revenue 5,843 5,154 13
Equipment sales 492 349 41
Total operating revenue 6,335 5,503 15
Operating expenses before the undernoted
Cost of equipment sales 1,005 703 43
Sales and marketing expenses 691 653 6
Operating, general and administrative expenses 1,833 1,558 18
3,529 2,914 21
Adjusted operating profit (1)(2) 2,806 2,589 8
Stock option plan amendment (3) – (46) n/m
Stock-based compensation recovery (expense) (3) 5 (11) n/m
Integration and restructuring expenses (4) (14) – n/m
Operating profit (1) $ 2,797 $ 2,532 10
Adjusted operating profit margin as % of network revenue (1) 48.0% 50.2%
Additions to PP&E (1) $ 929 $ 822 13
(1) As defined. See the sections entitled “Key Performance Indicators and Non-GAAP Measures” and “Supplementary Information: Non-GAAP Calculations”.
(2) Adjusted operating profit includes a loss of $14 million and $31 million related to the Inukshuk wireless broadband initiative for 2008 and 2007, respectively.
(3) See the section entitled “Stock-based Compensation”.
(4) Costs incurred relate to severances resulting from the restructuring of our employee base to improve our cost structure in light of the declining economic conditions.
Operating expenses are segregated into the following categories
for assessing business performance:
• Costofequipmentsales,representingcostsrelatedtoequipment
revenue;
• Salesandmarketingexpenses,consistingofcoststoacquirenew
subscribers, such as advertising, commissions paid to third par-
ties for new activations, remuneration and benefits to sales and
marketing employees as well as direct overheads related to these
activities; and
• Operating,generalandadministrativeexpenses,consistingpri-
marily of network operating expenses, customer care expenses,
retention costs, including residual commissions paid to distribu-
tion channels, Industry Canada licencing fees associated with
spectrum utilization, inter-carrier payments to roaming partners
and long-distance carriers, CRTC contribution levy and all other
expenses incurred to operate the business on a day-to-day basis.
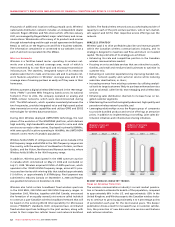
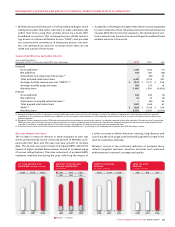
Wireless Operating Highlights for the Year Ended
December 31, 2008
• Networkrevenueincreasedby13%to$5,843millionin2008from
$5,154 million in 2007.
• Strongsubscribergrowthcontinuedin2008,withnetpostpaid
additions of 537,000 and net prepaid additions of 67,000.
• Postpaidsubscribermonthlychurnwas1.10%in2008,compared
to 1.15% in 2007.
• Postpaidmonthlyaveragerevenueperuser(“ARPU”)increased
4% from 2007 to $75.27, aided by strong growth in wireless data
revenue.
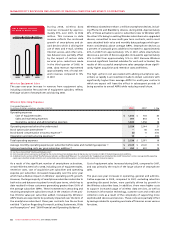
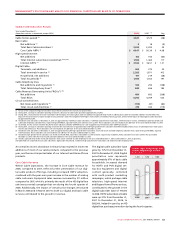
• Revenues from wireless data services grew approximately
39% year-over-year to $946 million in 2008 from $683 million in
2007, and represented approximately 16% of network revenue
compared to 13% in 2007.
• WirelesslaunchedtheAppleiPhone3GinCanadaonJuly11,2008
and activated approximately 385,000 of the devices during the
second half of the year. Approximately 35% of these activations
were to subscribers new to Wireless with 65% being to existing
Wireless subscribers who upgraded to the iPhone and commit-
ted to new three year term contracts. The vast majority of iPhone
subscribers have attached both voice and monthly data pack-
ages and are generating monthly ARPU considerably above the
monthly ARPU generated from Wireless’ overall subscriber base.
The initial sales volumes of this device drove significantly higher
acquisition and retention costs at Wireless.
• Canada’s AWS spectrum auction ended on July 21, 2008 fol-
lowing 39 days and 331 rounds of bidding with bids totalling
$4.25 billion. Wireless was the only carrier to successfully acquire
20 MHz of AWS spectrum across all 13 provinces and territories
with winning bids that totalled approximately $1.0 billion, or
approximately $1.67/MHz/pop.