Rogers 2008 Annual Report Download - page 24
Download and view the complete annual report
Please find page 24 of the 2008 Rogers annual report below. You can navigate through the pages in the report by either clicking on the pages listed below, or by using the keyword search tool below to find specific information within the annual report.-
 1
1 -
2
-
3
-
4
-
5
-
6
-
7
-
8
-
9
-
10
-
11
-
12
-
13
-
 14
14 -
 15
15 -
 16
16 -
 17
17 -
 18
18 -
 19
19 -
 20
20 -
 21
21 -
 22
22 -
 23
23 -
 24
24 -
 25
25 -
 26
26 -
 27
27 -
 28
28 -
 29
29 -
 30
30 -
 31
31 -
 32
32 -
 33
33 -
 34
34 -
35
-
36
-
37
-
38
-
39
-
40
-
41
-
42
-
43
-
44
-
45
-
46
-
47
-
48
-
49
-
50
-
51
-
52
-
53
-
54
-
55
-
56
-
57
-
58
-
59
-
60
-
61
-
62
-
63
-
64
-
65
-
66
-
67
-
68
-
69
-
70
-
71
-
72
-
73
-
74
-
75
-
76
-
77
-
78
-
79
-
80
-
81
-
82
-
83
-
84
-
85
-
86
-
87
-
88
-
89
-
90
-
91
-
92
-
93
-
94
-
95
-
96
-
97
-
98
-
99
-
100
-
101
-
102
-
103
-
104
-
105
-
106
-
107
-
108
-
109
-
110
-
111
-
112
-
113
-
114
-
115
-
116
-
117
-
118
-
119
-
120
-
121
-
122
-
123
-
124
-
125
-
126
-
127
-
128
-
129
-
130
-
131
-
132
-
133
-
134
-
135
-
136
 |
 |

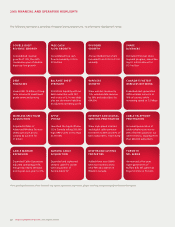
2008 FINANCIAL AND OPERATING HIGHLIGHTS
The following represents a sampling of Rogers Communications Inc.’s performance highlights for 2008.
For a detailed discussion of our financial and operating metrics and results, please see the accompanying MD&A later in this report.
20 ROGERS COMMUNICATIONS INC. 2008 ANNUAL REPORT
FREE CASH
FLOW GROWTH
Consolidated free cash
flow increased by 10% to
$1.5 billion
DIVIDEND
GROW TH
Annual dividend per share
increased from $0.50 to $1.00
annually
SHARE
BUYBACKS
Instituted first-ever share
buyback program, repurchas-
ing 4.1 million shares for
$137 million
DEBT
FINANCING
Issued US$1.75 billion of long-
term notes with investment
grade terms and pricing
BALANCE SHEET
STRENGTH
$1.8 billion liquidity with no
debt maturities until 2011,
and a ratio of 2.1 times debt
plus net derivative liabilities
to adjusted operating profit
WIRELESS
GROW TH
Grew wireless revenue by
15%, wireless data revenue
by 39% and subscribers by
604,000
CANADA’S FASTEST
WIRELESS NET WORK
Expanded next generation
HSPA wireless network to
76% of country while
increasing speed to 7.2 Mbps
WIRELESS SPECTRUM
ACQUISITION
Acquired 20 MHz of
Advanced Wireless Services
(AWS) spectrum across
Canada by auction for
$1 billion
APPLE
iPHONE
Launched the Apple iPhone
3G in Canada selling 385,000
high ARPU units in less than
six months
INTERNET AND DIGITAL
SERVICES PENETRATION
Grew high-speed Internet
and digital cable penetra-
tion levels to 68% and 67% of
basic subscribers, respectively
CABLE TELEPHONY
PENETRATION
Increased penetration of
cable telephony service to
24% of homes passed in our
cable territory, topping more
than 840,000 subscribers
CABLE MARGIN
EXPANSION
Expanded Cable Operations
adjusted operating profit
margins by nearly 200 basis
points year-over-year to 41%
AURORA C ABLE
ACQUISITION
Expanded and tightened
Ontario cable TV cluster
with acquisition of
Aurora Cable TV
NEW BROADCASTING
PROPERTIES
Added three new OMNI
television stations and a
new FM radio station in
Western Canada
TORONTO
NFL SERIES
Announced a five-year,
eight-game series of
Buffalo Bills NFL games at
Rogers Centre in Toronto
DOUBLE-DIGIT
REVENUE GROW TH
Consolidated revenue
growth of 12%, the sixth
consecutive year of double-
digit top-line growth