Rogers 2008 Annual Report Download - page 32
Download and view the complete annual report
Please find page 32 of the 2008 Rogers annual report below. You can navigate through the pages in the report by either clicking on the pages listed below, or by using the keyword search tool below to find specific information within the annual report.-
 1
1 -
2
-
3
-
4
-
5
-
6
-
7
-
8
-
9
-
10
-
11
-
12
-
13
-
14
-
15
-
16
-
17
-
18
-
19
-
20
-
21
-
 22
22 -
 23
23 -
 24
24 -
 25
25 -
 26
26 -
 27
27 -
 28
28 -
 29
29 -
 30
30 -
 31
31 -
 32
32 -
 33
33 -
 34
34 -
 35
35 -
 36
36 -
 37
37 -
 38
38 -
 39
39 -
 40
40 -
 41
41 -
 42
42 -
43
-
44
-
45
-
46
-
47
-
48
-
49
-
50
-
51
-
52
-
53
-
54
-
55
-
56
-
57
-
58
-
59
-
60
-
61
-
62
-
63
-
64
-
65
-
66
-
67
-
68
-
69
-
70
-
71
-
72
-
73
-
74
-
75
-
76
-
77
-
78
-
79
-
80
-
81
-
82
-
83
-
84
-
85
-
86
-
87
-
88
-
89
-
90
-
91
-
92
-
93
-
94
-
95
-
96
-
97
-
98
-
99
-
100
-
101
-
102
-
103
-
104
-
105
-
106
-
107
-
108
-
109
-
110
-
111
-
112
-
113
-
114
-
115
-
116
-
117
-
118
-
119
-
120
-
121
-
122
-
123
-
124
-
125
-
126
-
127
-
128
-
129
-
130
-
131
-
132
-
133
-
134
-
135
-
136
 |
 |

28 ROGERS COMMUNICATIONS INC. 2008 ANNUAL REPORT
MANAGEMENT’S DISCUSSION AND ANALYSIS OF FINANCIAL CONDITION AND RESULTS OF OPERATIONS
the option and acquiring Class B Non-Voting shares. All outstand-
ing stock options are now classified as liabilities and are carried at
their intrinsic value, as adjusted for vesting, measured as the differ-
ence between the current stock price and the option exercise price.
The intrinsic value of the liability is marked-to-market each period
and is amortized to expense over the period in which the related
services are rendered, which is usually the graded vesting period,
or, as applicable, over the period to the date an employee is eligible
to retire, whichever is shorter. As a result of this amendment, we
recorded a liability of $502 million, a one-time non-cash charge of
$452 million to revalue the outstanding options at May 28, 2007,
and a $50 million decrease in contributed surplus. This charge was
partially offset by a future income tax recovery of $160 million,
which was recorded as a result of the amendment.
Previously, all stock options were classified as equity and were mea-
sured at the estimated fair value established by the Black-Scholes
or binomial models on the date of grant. Under this method, the
estimated fair value was amortized to expense over the period in
which the related services were rendered, which was generally
the vesting period or, as applicable, over the period to the date an
employee was eligible to retire, whichever was shorter. Subsequent
to May 28, 2007, the liability for stock-based compensation expense
is recorded based on the intrinsic value of the options, as described
above, and the expense is impacted by the change in the price
of our Class B Non-Voting shares during the life of the option. At
December 31, 2008, we have a liability of $278 million related to
stock-based compensation recorded at its intrinsic value, including
stock options, restricted share units and deferred share units. In the
year ended December 31, 2008, $106 million (2007 – $80 million) was
paid to holders upon exercise of restricted share units and stock
options using the SAR feature.
A summary of stock-based compensation expense is as follows:
Stock-based Compensation
(Recovery) Expense Included in
Operating, General and
One-time Administrative Expenses
Non-cash Charge Years ended December 31,
Upon Adoption
(In millions of dollars) in Q2 2007 2008 2007
Wireless $ 46 $ (5) $ 11
Cable 113 (32) 11
Media 84 (17) 10
Corporate 209 (46) 30
$ 452 $ (100) $ 62
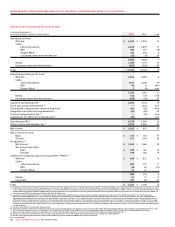
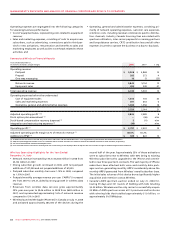
Reconciliation of Net Income to Operating Profit and Adjusted
Operating Profit for the Period
The items listed below represent the consolidated income and
expense amounts that are required to reconcile net income as
defined under Canadian GAAP to the non-GAAP measures operat-
ing profit and adjusted operating profit for the year. See the section
entitled “Supplementary Information: Non-GAAP Calculations”
for a full reconciliation to adjusted operating profit, adjusted net
income and adjusted net income per share. For details of these
amounts on a segment-by-segment basis and for an understand-
ing of intersegment eliminations on consolidation, the following
section should be read in conjunction with Note 3 to the 2008
Audited Consolidated Financial Statements entitled “Segmented
Information”.
Years ended December 31,
(In millions of dollars) 2008 2007 % Chg
Net income $ 1,002 $ 637 57
Income tax expense 424 249 70
Other expense (income), net (28) 4 n/m
Change in the fair value of derivative instruments (64) 34 n/m
Loss on repayment of long-term debt – 47 n/m
Foreign exchange loss (gain) 99 (54) n/m
Debt issuance costs 16 – n/m
Interest on long-term debt 575 579 (1)
Operating income 2,024 1,496 35
Impairment losses on goodwill, intangible assets and other long-term assets 294 – n/m
Depreciation and amortization 1,760 1,603 10
Operating profit 4,078 3,099 32
Stock option plan amendment – 452 n/m
Stock-based compensation (recovery) expense (100) 62 n/m
Integration and restructuring expenses 51 38 34
Adjustment for CRTC Part II fees decision 31 – n/m
Contract renegotiation fee – 52 n/m
Adjusted operating profit $ 4,060 $ 3,703 10