Rogers 2008 Annual Report Download - page 4
Download and view the complete annual report
Please find page 4 of the 2008 Rogers annual report below. You can navigate through the pages in the report by either clicking on the pages listed below, or by using the keyword search tool below to find specific information within the annual report.-
 1
1 -
 2
2 -
 3
3 -
 4
4 -
 5
5 -
 6
6 -
 7
7 -
 8
8 -
 9
9 -
 10
10 -
 11
11 -
 12
12 -
 13
13 -
 14
14 -
 15
15 -
16
-
17
-
18
-
19
-
20
-
21
-
22
-
23
-
24
-
25
-
26
-
27
-
28
-
29
-
30
-
31
-
32
-
33
-
34
-
35
-
36
-
37
-
38
-
39
-
40
-
41
-
42
-
43
-
44
-
45
-
46
-
47
-
48
-
49
-
50
-
51
-
52
-
53
-
54
-
55
-
56
-
57
-
58
-
59
-
60
-
61
-
62
-
63
-
64
-
65
-
66
-
67
-
68
-
69
-
70
-
71
-
72
-
73
-
74
-
75
-
76
-
77
-
78
-
79
-
80
-
81
-
82
-
83
-
84
-
85
-
86
-
87
-
88
-
89
-
90
-
91
-
92
-
93
-
94
-
95
-
96
-
97
-
98
-
99
-
100
-
101
-
102
-
103
-
104
-
105
-
106
-
107
-
108
-
109
-
110
-
111
-
112
-
113
-
114
-
115
-
116
-
117
-
118
-
119
-
120
-
121
-
122
-
123
-
124
-
125
-
126
-
127
-
128
-
129
-
130
-
131
-
132
-
133
-
134
-
135
-
136
 |
 |
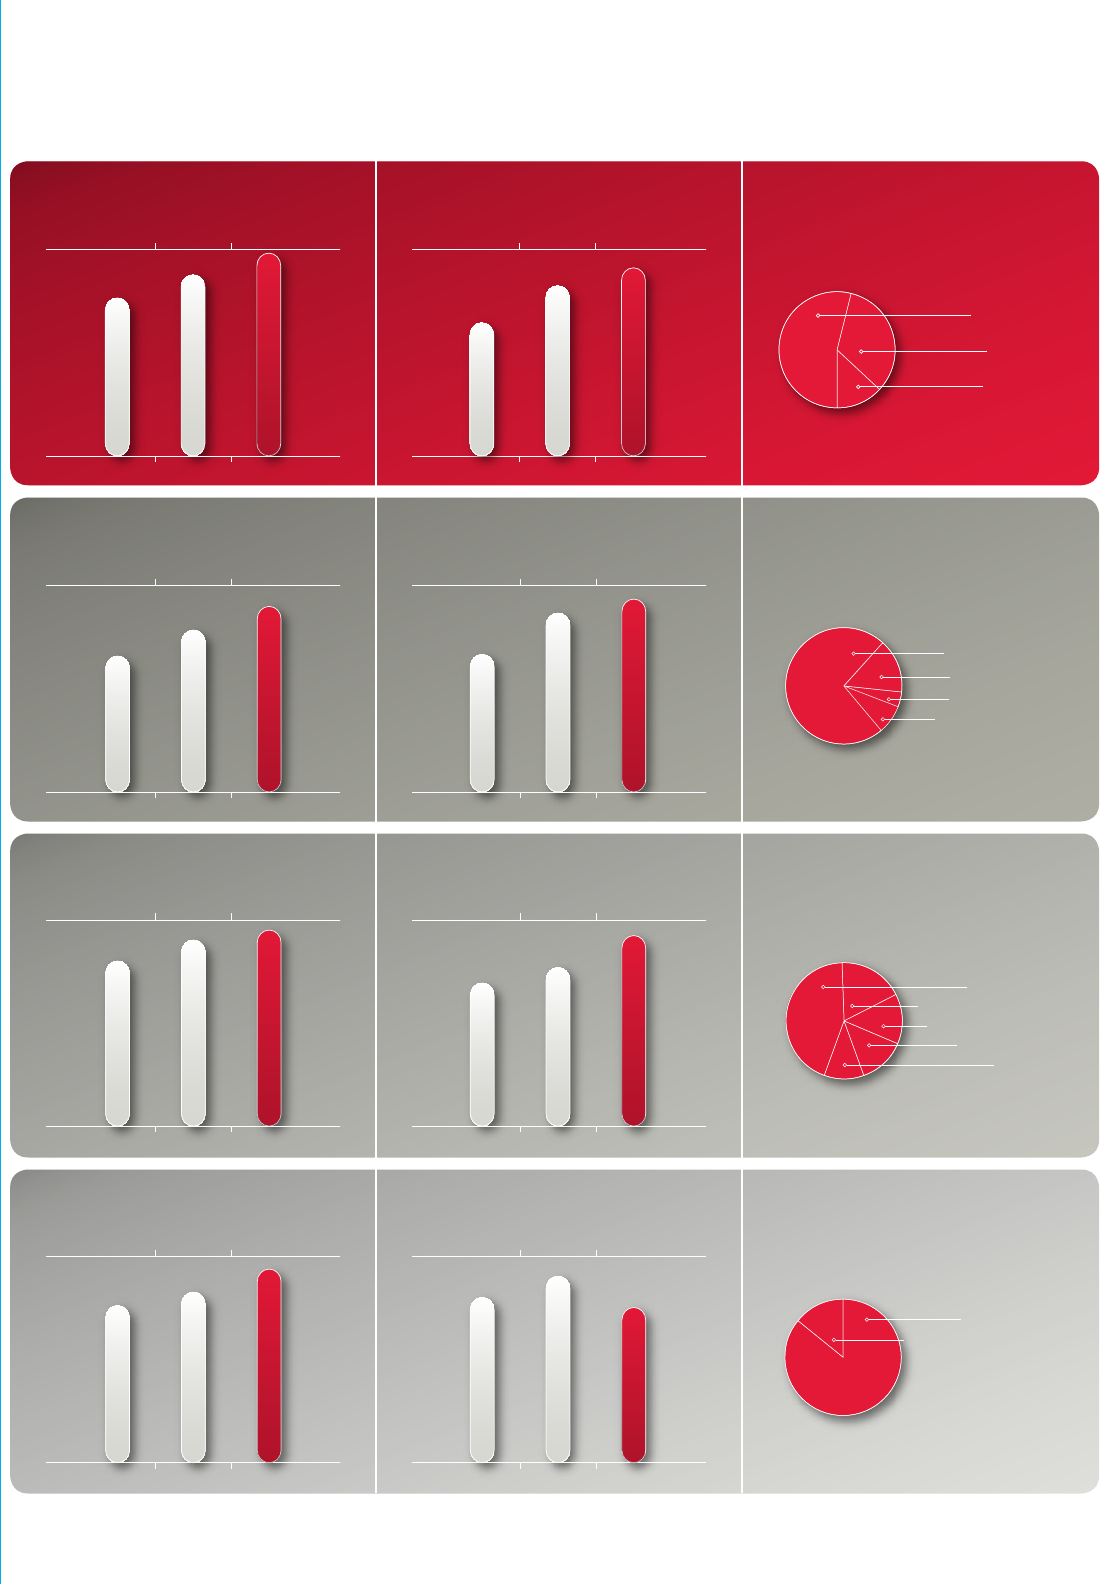
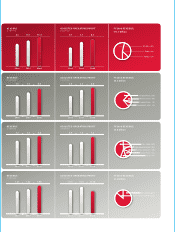
54%
33%
13%
Wireless
Cable
Media
73%
8%
15%
Postpaid Voice
Equipment sales
Wireless Data
4%Prepaid Voice
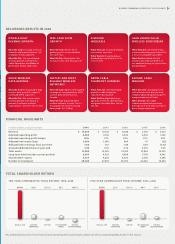
ADJUSTED OPERATING PROFIT
($ in billions)
ADJUSTED OPERATING PROFIT
($ in billions)
FY2008 REVENUE:
$11.3 billion
FY2008 REVENUE:
$6.3 billion
REVENUE
($ in billions)
REVENUE
($ in billions)
11.310.18.8
200820072006
6.35.54.6
200820072006
4.13.72.9
200820072006
2.82.62.0
200820072006
44%
Core Cable
14%
Business Solutions
11%
Retail
13%
Home Phone
18%
High-Speed Internet
ADJUSTED OPERATING PROFIT
($ in billions)
FY2008 REVENUE:
$3.8 billion
REVENUE
($ in billions)
3.83.63.2
200820072006
1.21.00.9
200820072006
86%
14%
Sports Entertainment
Core Media
ADJUSTED OPERATING PROFIT
($ in billions)
FY2008 REVENUE:
$1.5 billion
REVENUE
($ in billions)
1.501.321.21
200820072006
0.140.180.16
200820072006