Rogers 2008 Annual Report Download - page 51
Download and view the complete annual report
Please find page 51 of the 2008 Rogers annual report below. You can navigate through the pages in the report by either clicking on the pages listed below, or by using the keyword search tool below to find specific information within the annual report.-
 1
1 -
2
-
3
-
4
-
5
-
6
-
7
-
8
-
9
-
10
-
11
-
12
-
13
-
14
-
15
-
16
-
17
-
18
-
19
-
20
-
21
-
22
-
23
-
24
-
25
-
26
-
27
-
28
-
29
-
30
-
31
-
32
-
33
-
34
-
35
-
36
-
37
-
38
-
39
-
40
-
 41
41 -
 42
42 -
 43
43 -
 44
44 -
 45
45 -
 46
46 -
 47
47 -
 48
48 -
 49
49 -
 50
50 -
 51
51 -
 52
52 -
 53
53 -
 54
54 -
 55
55 -
 56
56 -
 57
57 -
 58
58 -
 59
59 -
 60
60 -
 61
61 -
62
-
63
-
64
-
65
-
66
-
67
-
68
-
69
-
70
-
71
-
72
-
73
-
74
-
75
-
76
-
77
-
78
-
79
-
80
-
81
-
82
-
83
-
84
-
85
-
86
-
87
-
88
-
89
-
90
-
91
-
92
-
93
-
94
-
95
-
96
-
97
-
98
-
99
-
100
-
101
-
102
-
103
-
104
-
105
-
106
-
107
-
108
-
109
-
110
-
111
-
112
-
113
-
114
-
115
-
116
-
117
-
118
-
119
-
120
-
121
-
122
-
123
-
124
-
125
-
126
-
127
-
128
-
129
-
130
-
131
-
132
-
133
-
134
-
135
-
136
 |
 |

ROGERS COMMUNICATIONS INC. 2008 ANNUAL REPORT 47
MANAGEMENT’S DISCUSSION AND ANALYSIS OF FINANCIAL CONDITION AND RESULTS OF OPERATIONS
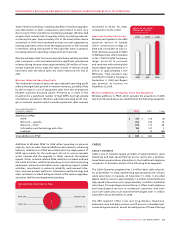
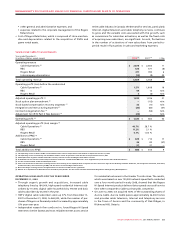
ROGERS RETAIL
Summarized Financial Results
Years ended December 31,
(In millions of dollars) 2008 2007 % Chg
Rogers Retail operating revenue $ 417 $ 393 6
Operating expenses 414 397 4
Adjusted operating profit (loss) (1) 3 (4) n/m
Stock option plan amendment (2) – (5) n/m
Stock-based compensation recovery (expense) (2) 1 (1) n/m
Integration and restructuring expenses (3) (5) – n/m
Operating loss (1) $ (1) $ (10) (90)
Adjusted operating profit (loss) margin (1) 0.7% (1.0%)
(1) As defined. See the sections entitled “Key Performance Indicators and Non-GAAP Measures” and “Supplementary Information: Non-GAAP Calculations”.
(2) See the section entitled “Stock-based Compensation”.
(3) Costs incurred relate to severances resulting from the restructuring of our employee base to improve our cost structure in light of the declining economic conditions and the closure of certain Rogers
Retail stores.
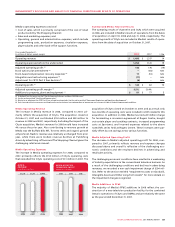
Rogers Retail Revenue
The increases in Rogers Retail revenue in 2008, compared to 2007,
were the result of increased sales of wireless products and services,
partially offset by the continued decline in video rentals.
Rogers Retail Adjusted Operating Profit (Loss)
Adjusted operating profit at Rogers Retail for 2008, compared to
the prior year, reflects the trends noted above.
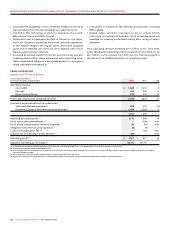
CABLE ADDITIONS TO PP&E
The Cable Operations segment categorizes its PP&E expenditures
according to a standardized set of reporting categories that were
developed and agreed to by the U.S. cable television industry and
which facilitate comparisons of additions to PP&E between dif-
ferent cable companies. Under these industry definitions, Cable
Operations additions to PP&E are classified into the following five
categories:
• Customerpremiseequipment(“CPE”),whichincludestheequip-
ment for digital set-top terminals, Internet modems and associated
installation costs;
• Scalable infrastructure, which includes non-CPE costs to meet
business growth and to provide service enhancements, including
many of the costs to-date of the cable telephony initiative;
• Lineextensions,whichincludesnetworkcoststoenternewser-
vice areas;
• Upgrades and rebuild, which includes the costs to modify or
replace existing co-axial cable, fibre-optic equipment and net-
work electronics; and
• Supportcapital,whichincludesthecostsassociatedwiththepur-
chase, replacement or enhancement of non-network assets.
Summarized Cable PP&E Additions
Years ended December 31,
(In millions of dollars) 2008 2007 % Chg
Additions to PP&E
Customer premise equipment $ 284 $ 304 (7)
Scalable infrastructure 279 167 67
Line extensions 48 57 (16)
Upgrades and rebuild 35 43 (19)
Support capital 183 139 32
Total Cable Operations 829 710 17
RBS 36 83 (57)
Rogers Retail 21 21 –
$ 886 $ 814 9
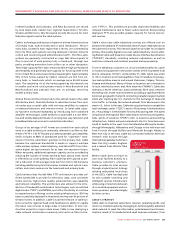
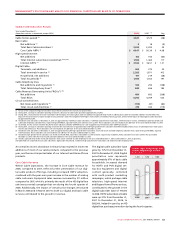
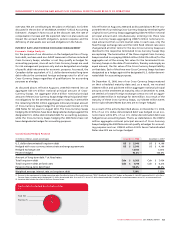
2008 CABLE ADDITIONS TO PP&E
(%)
Cable Operations 94%
Retail 2%
Business Solutions 4%