Rogers 2008 Annual Report Download - page 31
Download and view the complete annual report
Please find page 31 of the 2008 Rogers annual report below. You can navigate through the pages in the report by either clicking on the pages listed below, or by using the keyword search tool below to find specific information within the annual report.-
 1
1 -
2
-
3
-
4
-
5
-
6
-
7
-
8
-
9
-
10
-
11
-
12
-
13
-
14
-
15
-
16
-
17
-
18
-
19
-
20
-
 21
21 -
 22
22 -
 23
23 -
 24
24 -
 25
25 -
 26
26 -
 27
27 -
 28
28 -
 29
29 -
 30
30 -
 31
31 -
 32
32 -
 33
33 -
 34
34 -
 35
35 -
 36
36 -
 37
37 -
 38
38 -
 39
39 -
 40
40 -
 41
41 -
42
-
43
-
44
-
45
-
46
-
47
-
48
-
49
-
50
-
51
-
52
-
53
-
54
-
55
-
56
-
57
-
58
-
59
-
60
-
61
-
62
-
63
-
64
-
65
-
66
-
67
-
68
-
69
-
70
-
71
-
72
-
73
-
74
-
75
-
76
-
77
-
78
-
79
-
80
-
81
-
82
-
83
-
84
-
85
-
86
-
87
-
88
-
89
-
90
-
91
-
92
-
93
-
94
-
95
-
96
-
97
-
98
-
99
-
100
-
101
-
102
-
103
-
104
-
105
-
106
-
107
-
108
-
109
-
110
-
111
-
112
-
113
-
114
-
115
-
116
-
117
-
118
-
119
-
120
-
121
-
122
-
123
-
124
-
125
-
126
-
127
-
128
-
129
-
130
-
131
-
132
-
133
-
134
-
135
-
136
 |
 |

ROGERS COMMUNICATIONS INC. 2008 ANNUAL REPORT 27
MANAGEMENT’S DISCUSSION AND ANALYSIS OF FINANCIAL CONDITION AND RESULTS OF OPERATIONS
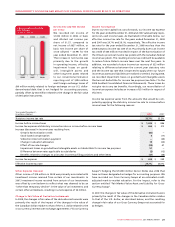
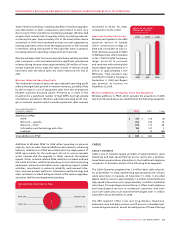
Our consolidated revenue was $11,335 million in 2008, an increase of
$1,212 million, or 12%, from $10,123 million in 2007. Of the increase,
Wireless contributed $832 million, Cable $251 million, and Media
$179 million, offset by an increase in corporate items and elimina-
tions of $50 million.
Our consolidated adjusted operating profit was $4,060 million,
an increase of $357 million, or 10%, from $3,703 million in 2007. Of
this increase, Wireless contributed $217 million, Cable contributed
$217 million, and Media partially offset the increase with a decline
of $34 million. On a consolidated basis, we recorded net income of
$1,002 million for the year ended December 31, 2008, compared to
net income of $637 million in 2007.
Refer to the respective individual segment discussions for details of
the revenue, operating expenses, operating profit and additions to
PP&E of Wireless, Cable and Media.
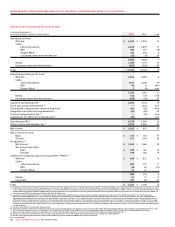
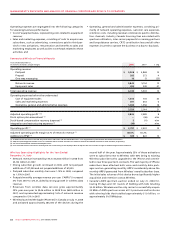
2008 Performance Against Targets
The following table sets forth the guidance ranges for selected full
year financial and operating metrics that we provided for 2008, as
revised during the year, versus the actual results we achieved for
the year. Certain of the measures included below are not defined
under Canadian GAAP.
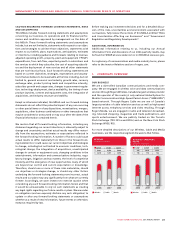
Our actual 2008 consolidated revenue, adjusted operating profit,
PP&E expenditures and free cash flow were within the updated
guidance ranges provided. Cable Operations revenue, Media rev-
enue and Cable RGUs were below the guidance that was provided.
Cable Operations revenue and RGUs were below guidance resulting
from softness in the Canadian economy, saturation of the Internet
market and competitive offerings in the market. The Media rev-
enue was also below the guidance range provided resulting from
softness in the Canadian economy which led to lower advertising
revenues. PP&E additions at Wireless exceeded our guidance par-
tially in order to support subscriber growth as well as investments
in growth initiatives. See the section entitled “Wireless Additions
to Property, Plant and Equipment” for further details on Wireless
PP&E additions.
Stock-based Compensation
On May 28, 2007, our employee stock option plans were amended
to attach cash settled share appreciation rights (“SARs”) to all new
and previously granted options. The SAR feature allows the option
holder to elect to receive in cash an amount equal to the intrin-
sic value, being the excess market price of the Class B Non-Voting
share over the exercise price of the option, instead of exercising
Original 2008 Guidance Updated from Original 2008
(Millions of dollars, except subscribers) (At January 7, 2008) Guidance (At October 28, 2008) Actual
Consolidated
Revenue $ 11,200 to $ 11,500 $ 11,200 to $ 11,500 $ 11,335
Adjusted operating profit (1) 4,000 to 4,200 4,000 to 4,100 4,060
PP&E expenditures 1,900 to 2,100 1,900 to 2,100 2,021
Free cash flow (2) 1,400 to 1,600 1,400 to 1,600 1,464
Revenue
Wireless (network revenue) $ 5,800 to $ 5,900 $ 5,800 to $ 5,900 $ 5,843
Cable Operations 2,900 to 2,950 2,900 to 2,950 2,878
Media 1,525 to 1,575 1,480 to 1,510 1,496
Adjusted operating profit (1)
Wireless (3) $ 2,875 to $ 2,975 $ 2,800 to $ 2,850 $ 2,820
Cable Operations 1,130 to 1,190 1,130 to 1,190 1,171
Media (4) 165 to 180 145 to 155 142
Additions to PP&E
Wireless $ 850 to $ 925 $ 850 to $ 925 $ 929
Cable Operations 750 to 830 750 to 830 829
Media 80 to 95 80 to 95 81
Net subscriber additions (000s)
Retail wireless postpaid and prepaid 550 to 625 550 to 625 604
Residential cable revenue generating units (RGUs) (5) 550 to 625 410 to 440 365
(1) Excludes the impact of stock-based compensation expense, integration and restructuring expenses and a one-time charge related to CRTC Part II fees.
(2) Free cash flow is defined as adjusted operating profit less PP&E expenditures and interest expense and is not a term defined under Canadian GAAP.
(3) Excludes operating losses related to the Inukshuk fixed wireless initiative of $14 million in 2008.
(4) Includes losses from Sports Entertainment of $33 million in 2008.
(5) Residential cable RGUs are comprised of basic cable subscribers, digital cable households, residential high-speed Internet subscribers and residential cable and circuit-switched telephony subscribers.