Rogers 2008 Annual Report Download - page 28
Download and view the complete annual report
Please find page 28 of the 2008 Rogers annual report below. You can navigate through the pages in the report by either clicking on the pages listed below, or by using the keyword search tool below to find specific information within the annual report.-
 1
1 -
2
-
3
-
4
-
5
-
6
-
7
-
8
-
9
-
10
-
11
-
12
-
13
-
14
-
15
-
16
-
17
-
 18
18 -
 19
19 -
 20
20 -
 21
21 -
 22
22 -
 23
23 -
 24
24 -
 25
25 -
 26
26 -
 27
27 -
 28
28 -
 29
29 -
 30
30 -
 31
31 -
 32
32 -
 33
33 -
 34
34 -
 35
35 -
 36
36 -
 37
37 -
 38
38 -
39
-
40
-
41
-
42
-
43
-
44
-
45
-
46
-
47
-
48
-
49
-
50
-
51
-
52
-
53
-
54
-
55
-
56
-
57
-
58
-
59
-
60
-
61
-
62
-
63
-
64
-
65
-
66
-
67
-
68
-
69
-
70
-
71
-
72
-
73
-
74
-
75
-
76
-
77
-
78
-
79
-
80
-
81
-
82
-
83
-
84
-
85
-
86
-
87
-
88
-
89
-
90
-
91
-
92
-
93
-
94
-
95
-
96
-
97
-
98
-
99
-
100
-
101
-
102
-
103
-
104
-
105
-
106
-
107
-
108
-
109
-
110
-
111
-
112
-
113
-
114
-
115
-
116
-
117
-
118
-
119
-
120
-
121
-
122
-
123
-
124
-
125
-
126
-
127
-
128
-
129
-
130
-
131
-
132
-
133
-
134
-
135
-
136
 |
 |

24 ROGERS COMMUNICATIONS INC. 2008 ANNUAL REPORT
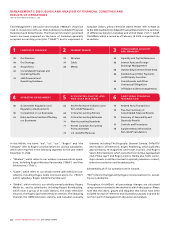
MANAGEMENT’S DISCUSSION AND ANALYSIS OF FINANCIAL CONDITION AND RESULTS OF OPERATIONS
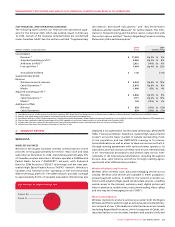
OUR STRATEGY
Our business objective is to maximize subscribers, revenue, operat-
ing profit and return on invested capital by enhancing our position
as one of Canada’s leading diversified communications and media
companies. Our strategy is to be the preferred provider of commu-
nications, entertainment and information services to Canadians. We
seek to leverage our networks, infrastructure, sales channels, brand
and marketing resources across the Rogers group of companies by
implementing cross-selling and joint sales distribution initiatives as
well as cost-reduction initiatives through infrastructure sharing, to
create value for our customers and shareholders.
We help to identify and facilitate opportunities for Wireless, Cable
and Media to create bundled product and service offerings at
attractive prices, in addition to implementing cross-marketing and
cross-promotion of products and services to increase sales and
enhance subscriber loyalty. We also work to identify and implement
areas of opportunity for our businesses that will enhance operating
efficiencies by sharing infrastructure, corporate services and sales
distribution channels. We continue to develop brand awareness
and promote the “Rogers” brand as a symbol of quality, innovation
and value of a diversified Canadian media and communications
company.
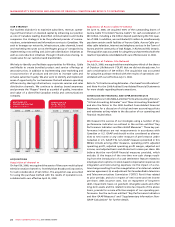
ACQUISITIONS
Acquisition of channel m
On April 30, 2008, we acquired the assets of Vancouver multicultural
television station channel m, from Multivan Broadcast Corporation,
for cash consideration of $61 million. The acquisition was accounted
for using the purchase method with the results of operations con-
solidated with ours effective April 30, 2008.
Acquisition of Aurora Cable TV Limited
On June 12, 2008, we acquired 100% of the outstanding shares of
Aurora Cable TV Limited (“Aurora Cable”) for cash consideration of
$80 million, including a $16 million deposit paid during the first quar-
ter of 2008. In addition, we contributed $10 million to simultaneously
pay down certain credit facilities of Aurora Cable. Aurora Cable pro-
vides cable television, Internet and telephony services in the Town of
Aurora and the community of Oak Ridges, in Richmond Hill, Ontario.
The acquisition was accounted for using the purchase method with the
results of operations consolidated with ours effective June 12, 2008.
Acquisition of Outdoor Life Network
On July 31, 2008, we acquired the remaining two-thirds of the shares
of Outdoor Life Network (“OLN”) that we did not already own, for
cash consideration of $39 million. The acquisition was accounted
for using the purchase method with the results of operations con-
solidated with ours effective July 31, 2008.
Refer to “Critical Accounting Estimates – Purchase Price Allocations”
and Note 4 to the 2008 Audited Consolidated Financial Statements
for more details regarding these transactions.
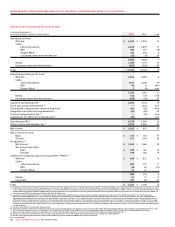
CONSOLIDATED FINANCIAL AND OPERATING RESULTS
See the sections in this MD&A entitled “Critical Accounting Policies”,
“Critical Accounting Estimates” and “New Accounting Standards”
and also the Notes to the 2008 Audited Consolidated Financial
Statements for a discussion of critical and new accounting policies
and estimates as they relate to the discussion of our operating and
financial results below.
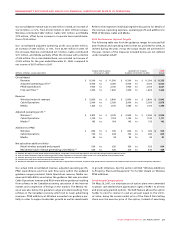
We measure the success of our strategies using a number of key
performance indicators as outlined in the section entitled “Key
Performance Indicators and Non-GAAP Measures”. These key per-
formance indicators are not measurements in accordance with
Canadian or U.S. GAAP and should not be considered as alterna-
tives to net income or any other measure of performance under
Canadian or U.S. GAAP. The non-GAAP measures presented in this
MD&A include, among other measures, operating profit, adjusted
operating profit, adjusted operating profit margin, adjusted net
income, and adjusted basic and diluted net income per share. We
believe that the non-GAAP financial measures provided, which
exclude: (i) the impact of the one-time non-cash charge result-
ing from the introduction of a cash settlement feature related to
employee stock options; (ii) stock-based compensation expense; (iii)
integration and restructuring expenses; (iv) the impact of a one-
time charge resulting from the renegotiation of an Internet-related
services agreement; (v) an adjustment for Canadian Radio-television
and Telecommunications Commission (“CRTC”) Part II fees related
to prior periods; and (vi) in respect of net income and net income
per share, debt issuance costs, loss on repayment of long-term
debt, impairment losses on goodwill, intangible assets and other
long-term assets and the related income tax impacts of the above
items, provide for a more effective analysis of our operating per-
formance. See the sections entitled “Key Performance Indicators
and Non-GAAP Measures” and “Supplementary Information: Non-
GAAP Calculations” for further details.
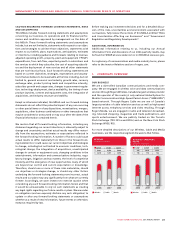
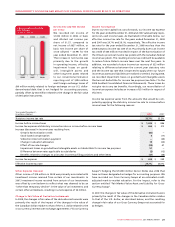
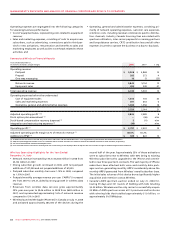
20082007
$2,021$1,796$1,712
ADDITIONS TO
CONSOLIDATED PP&E
(In millions of dollars)
2006
20082007
$17,093$15,325$14,105
CONSOLIDATED
TOTAL ASSETS
(In millions of dollars)
200
7
2008
2006