Rogers 2008 Annual Report Download - page 50
Download and view the complete annual report
Please find page 50 of the 2008 Rogers annual report below. You can navigate through the pages in the report by either clicking on the pages listed below, or by using the keyword search tool below to find specific information within the annual report.-
 1
1 -
2
-
3
-
4
-
5
-
6
-
7
-
8
-
9
-
10
-
11
-
12
-
13
-
14
-
15
-
16
-
17
-
18
-
19
-
20
-
21
-
22
-
23
-
24
-
25
-
26
-
27
-
28
-
29
-
30
-
31
-
32
-
33
-
34
-
35
-
36
-
37
-
38
-
39
-
 40
40 -
 41
41 -
 42
42 -
 43
43 -
 44
44 -
 45
45 -
 46
46 -
 47
47 -
 48
48 -
 49
49 -
 50
50 -
 51
51 -
 52
52 -
 53
53 -
 54
54 -
 55
55 -
 56
56 -
 57
57 -
 58
58 -
 59
59 -
 60
60 -
61
-
62
-
63
-
64
-
65
-
66
-
67
-
68
-
69
-
70
-
71
-
72
-
73
-
74
-
75
-
76
-
77
-
78
-
79
-
80
-
81
-
82
-
83
-
84
-
85
-
86
-
87
-
88
-
89
-
90
-
91
-
92
-
93
-
94
-
95
-
96
-
97
-
98
-
99
-
100
-
101
-
102
-
103
-
104
-
105
-
106
-
107
-
108
-
109
-
110
-
111
-
112
-
113
-
114
-
115
-
116
-
117
-
118
-
119
-
120
-
121
-
122
-
123
-
124
-
125
-
126
-
127
-
128
-
129
-
130
-
131
-
132
-
133
-
134
-
135
-
136
 |
 |

46 ROGERS COMMUNICATIONS INC. 2008 ANNUAL REPORT
MANAGEMENT’S DISCUSSION AND ANALYSIS OF FINANCIAL CONDITION AND RESULTS OF OPERATIONS
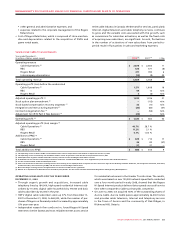
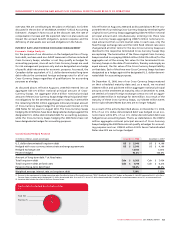
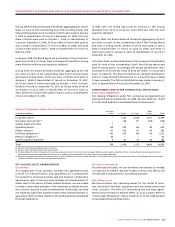
Summarized Subscriber Results
Years ended December 31,
(Subscriber statistics in thousands) 2008 2007 % Chg
Local line equivalents (1)
Total local line equivalents (2) 197 237 (40)
Broadband data circuits (3)
Total broadband data circuits (2) (4) 34 35 (1)
(1) Local line equivalents include individual voice lines plus Primary Rate Interfaces (“PRIs”) at a factor of 23 voice lines each.
(2) Included in total subscribers at December 31, 2007 are approximately 14,000 local line equivalents and 1,000 broadband data circuits acquired from Futureway. These subscribers are not included in net
additions for 2007.
(3) Broadband data circuits are those customer locations accessed by data networking technologies including DOCSIS, DSL, E10/100/1000, OC 3/12 and DS 1/3.
(4) During the first quarter of 2008, a change in subscriber reporting resulted in the reclassification of approximately 4,000 high-speed Internet subscribers from RBS’ broadband data circuits to Cable
Operations’ high-speed Internet subscriber base. These subscribers are not included in net additions for 2008.
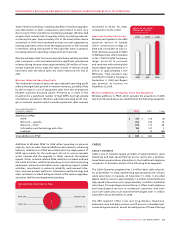
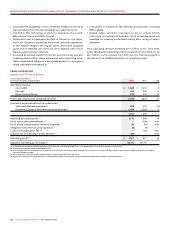
RBS Revenue
The decrease in RBS revenues reflects a decline in long-distance
and legacy data service businesses, with a shift in focus to increas-
ing the strength of profitable relationships and leveraging revenue
opportunities over Cable’s existing network. RBS continues to focus
on retaining its existing medium-enterprise and carrier customer
base, but in late 2007 it suspended most sales and marketing initia-
tives related to acquiring new medium and large business customers
other than purely on-net opportunities within Cable’s footprint. RBS
continues to focus on managing the profitability of its existing cus-
tomer base and evaluate profitable opportunities within the medium
and large enterprise and carrier segments, while Cable Operations
focuses on continuing to grow Rogers’ penetration of telephony
and Internet services into the small business and home office mar-
kets within Cable’s territory. For 2008, RBS long-distance revenue
declined $22 million and data revenue declined $18 million.
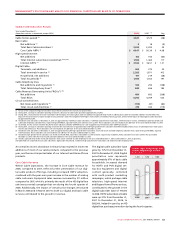
RBS Operating Expenses
Carrier charges of $300 million, included in operating, general and
administrative expenses, decreased by $14 million in 2008, com-
pared to 2007, due to the decrease in revenue and focus on on-net
services. Carrier charges represented approximately 57% of reve-
nue in 2008, essentially unchanged from 2007 where carrier charges
represented 55% of revenue.
The decrease in other operating, general and administrative
expenses, excluding carrier charges, is primarily related to lower
technical service and information technology costs compared to
2007. The $49 million reduction in sales and marketing expenses for
2008, compared to the prior year, reflects streamlining initiatives
associated with the refocusing of RBS’ business as discussed above.
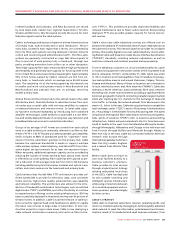
RBS Adjusted Operating Profit
The changes described above resulted in RBS adjusted operating
profit of $59 million for 2008 compared to an adjusted operating
profit of $12 million in 2007.
Integration and Restructuring Expenses
During 2008, RBS incurred costs of approximately $2 million related
to severances resulting from the targeted restructuring of our
employee base to improve our cost structure in light of the declin-
ing economic conditions and approximately $4 million in additional
costs related to the Call-Net integration and RBS restructuring.
During 2007, most RBS new customer acquisition efforts in the
enterprise and larger business segments and outside of Cable’s
footprint were suspended, resulting in certain staff reductions and
the incurrence of approximately $20 million in severance costs. In
addition, consulting and contract termination costs of $4 million
related to the restructuring and $5 million of integration expenses
related to the acquisition of Call-Net were incurred.