Rogers 2008 Annual Report Download - page 2
Download and view the complete annual report
Please find page 2 of the 2008 Rogers annual report below. You can navigate through the pages in the report by either clicking on the pages listed below, or by using the keyword search tool below to find specific information within the annual report.-
 1
1 -
 2
2 -
 3
3 -
 4
4 -
 5
5 -
 6
6 -
 7
7 -
 8
8 -
 9
9 -
 10
10 -
 11
11 -
 12
12 -
 13
13 -
14
-
15
-
16
-
17
-
18
-
19
-
20
-
21
-
22
-
23
-
24
-
25
-
26
-
27
-
28
-
29
-
30
-
31
-
32
-
33
-
34
-
35
-
36
-
37
-
38
-
39
-
40
-
41
-
42
-
43
-
44
-
45
-
46
-
47
-
48
-
49
-
50
-
51
-
52
-
53
-
54
-
55
-
56
-
57
-
58
-
59
-
60
-
61
-
62
-
63
-
64
-
65
-
66
-
67
-
68
-
69
-
70
-
71
-
72
-
73
-
74
-
75
-
76
-
77
-
78
-
79
-
80
-
81
-
82
-
83
-
84
-
85
-
86
-
87
-
88
-
89
-
90
-
91
-
92
-
93
-
94
-
95
-
96
-
97
-
98
-
99
-
100
-
101
-
102
-
103
-
104
-
105
-
106
-
107
-
108
-
109
-
110
-
111
-
112
-
113
-
114
-
115
-
116
-
117
-
118
-
119
-
120
-
121
-
122
-
123
-
124
-
125
-
126
-
127
-
128
-
129
-
130
-
131
-
132
-
133
-
134
-
135
-
136
 |
 |

ROGERS COMMUNICATIONS INC. AT A GLANCE
TOTAL SHAREHOLDER RETURN
FIVE-YEAR COMPARATIVE TOTAL RETURN: 2003–2008
S&P 500S&P/TSX
COMPOSITE
RCI.b on TSX
(10%)23%259%
TSX TELECOM
INDEX
S&P 500
TELECOM INDEX
49% 20%
S&P 500S&P/TSX
COMPOSITE
RCI.b on TSX
(13%)68%464%
TSX TELECOM
INDEX
S&P 500
TELECOM INDEX
52% (46%)
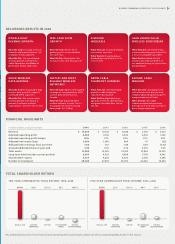
For a detailed discussion of our financial and operating metrics and results, please see the accompanying MD&A later in this report.
FINANCIAL HIGHLIGHTS
(In millions of dollars, except per share data) 2008 2007 2006 2005 2004
Revenue $ 11,335 $ 10,123 $ 8,838 $ 7,334 $ 5,514
Adjusted operating profit 4,060 3,703 2,942 2,252 1,752
Adjusted operating profit margin 36% 37% 33% 31% 32%
Adjusted net income (loss) 1,260 1,066 684 47 (32)
Adjusted basic earnings (loss) per share 1.98 1.67 1.08 0.08 (0.07)
Annualized dividend rate at year-end 1.00 0.50 0.16 0.075 0.05
Total assets 17,093 15,325 14,105 13,834 13,273
Long-term debt (includes current portion) 8,507 6,033 6,988 7,739 8,542
Shareholders‘ equity 4,727 4,624 4,200 3,528 2,385
Number of employees 29,200 27,900 25,700 22,600 19,300
TEN-YEAR COMPARATIVE TOTAL RETURN: 1998–2008
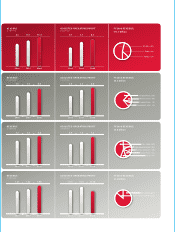
What We Said: Deliver 5% or
greater growth in consolidated
free cash flow.
What We Did: Generated a 10%
increase in free cash flow growth.
FREE CASH FLOW
GROWTH
What We Said: Increase dividends
consistently over time.
What We Did: Doubled annual
dividend per share from $0.50 to
$1.00 in 2008.
DIVIDEND
INCREASES
What We Said: Continued strong
wireless subscriber growth but with
a focus on postpaid subscribers.
What We Did: Added 604,000
wireless subscribers with 89% of
net additions being on higher value
postpaid plans.
GAIN HIGHER VALUE
WIRELESS SUBSCRIBERS
What We Said: Strong double-digit
wireless data growth to support
continued ARPU expansion.
What We Did: 39% wireless data
revenue growth with data as a
percent of network revenue
expanding to 16% from 13% in 2007.
GROW WIRELESS
DATA REVENUE
What We Said: Significantly expand
coverage of next-generation HSPA
wireless data network across
Canada.
What We Did: Expanded HSPA
wireless network to cover 76% of
the population while increasing
data speeds to 7.2 Mbps.
FASTEST AND MOST
RELIABLE WIRELESS
NETWORKS
What We Said: Continued rapid
growth in cable telephony
subscribers during 2008.
What We Did: Expanded cover-
age area to 95% of cable territory
and grew subscriber base 28% to
840,000.
GROW CABLE
TELEPHONY BUSINESS
What We Said: Leverage growth
with efficiencies to drive at least
100bp of adjusted operating profit
margin expansion at Cable.
What We Did: 16% Cable
Operations adjusted operating
profit growth with nearly 200 basis
point margin expansion.
EXPAND C ABLE
MARGINS
DELIVERING RESULTS IN 2008
DOUBLE-DIGIT
REVENUE GROWTH
What We Said: Leverage networks,
channels and brand to deliver 11%
or greater revenue growth.
What We Did: 12% consolidated
revenue growth with Wireless,
Cable Operations and Media all
growing at double-digit rates.