Rogers 2008 Annual Report Download - page 123
Download and view the complete annual report
Please find page 123 of the 2008 Rogers annual report below. You can navigate through the pages in the report by either clicking on the pages listed below, or by using the keyword search tool below to find specific information within the annual report.-
 1
1 -
2
-
3
-
4
-
5
-
6
-
7
-
8
-
9
-
10
-
11
-
12
-
13
-
14
-
15
-
16
-
17
-
18
-
19
-
20
-
21
-
22
-
23
-
24
-
25
-
26
-
27
-
28
-
29
-
30
-
31
-
32
-
33
-
34
-
35
-
36
-
37
-
38
-
39
-
40
-
41
-
42
-
43
-
44
-
45
-
46
-
47
-
48
-
49
-
50
-
51
-
52
-
53
-
54
-
55
-
56
-
57
-
58
-
59
-
60
-
61
-
62
-
63
-
64
-
65
-
66
-
67
-
68
-
69
-
70
-
71
-
72
-
73
-
74
-
75
-
76
-
77
-
78
-
79
-
80
-
81
-
82
-
83
-
84
-
85
-
86
-
87
-
88
-
89
-
90
-
91
-
92
-
93
-
94
-
95
-
96
-
97
-
98
-
99
-
100
-
101
-
102
-
103
-
104
-
105
-
106
-
107
-
108
-
109
-
110
-
111
-
112
-
 113
113 -
 114
114 -
 115
115 -
 116
116 -
 117
117 -
 118
118 -
 119
119 -
 120
120 -
 121
121 -
 122
122 -
 123
123 -
 124
124 -
 125
125 -
 126
126 -
 127
127 -
 128
128 -
 129
129 -
 130
130 -
 131
131 -
 132
132 -
 133
133 -
134
-
135
-
136
 |
 |

ROGERS COMMUNICATIONS INC. 2008 ANNUAL REPORT 119
NOTES TO CONSOLIDATED FINANCIAL STATEMENTS
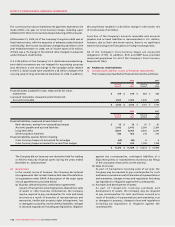
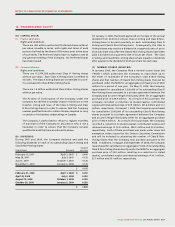
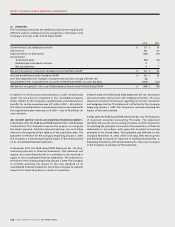
At December 31, 2008, the range of exercise prices, the weighted
average exercise price and the weighted average remaining
contractual life are as follows:
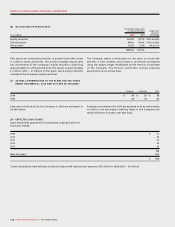
At December 31, 2008, a summary of the stock option plans is as follows:
2008 2007
Weighted Weighted
average average
Number of exercise Number of exercise
options price options price
Outstanding, beginning of year 15,586,066 $ 15.96 19,694,860 $ 11.17
Granted 2,148,110 38.83 1,886,088 39.19
Exercised (3,804,520) 10.55 (5,847,046) 7.17
Forfeited (88,036) 34.69 (147,836) 20.16
Outstanding, end of year 13,841,620 $ 20.80 15,586,066 $ 15.96
Exercisable, end of year 9,228,740 $ 13.82 11,409,666 $ 11.41
Options outstanding Options exercisable
Weighted
average Weighted Weighted
remaining average average
Range of Number contractual exercise Number exercise
exercise prices outstanding life (years) price exercisable price
$ 1.38 – $ 6.99 774,518 3.4 $ 5.50 774,518 $ 5.50
$ 7.00 – $ 9.99 1,380,632 4.4 8.41 1,380,632 8.41
$10.00 – $10.99 2,358,650 4.7 10.43 2,358,650 10.43
$11.00 – $11.99 702,096 2.1 11.82 702,096 11.82
$12.00 – $16.99 1,819,679 4.1 13.88 1,661,154 13.59
$17.00 – $18.99 943,859 1.5 17.87 938,614 17.87
$19.00 – $37.99 2,003,144 7.2 23.13 975,501 22.82
$38.00 – $47.99 3,859,042 8.7 39.04 437,575 39.21
13,841,620 5.7 20.80 9,228,740 13.82
The weighted average estimated fair value at the date of grant
for options granted from January 1, 2007 to May 28, 2007 was
$13.62 per share.
For in-the-money stock options measured at the Company’s
December 31 share price, unrecognized stock-based compensation
expense related to stock-option plans was $3 million (2007 –
$20 million), and will be recorded in the consolidated statements of
income over the next four years.
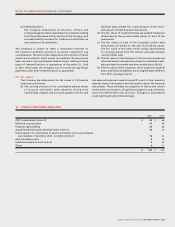
(iii) Performance options:
During the year ended December 31, 2008, the Company
granted 1,142,300 (2007 – 1,036,200) performance-based
options to certain key executives. These options are governed
by the terms of the 2000 Plan. These options vest on a straight-
line basis over four years provided that certain targeted stock
prices are met on or after the anniversary date.
As a result of the May 28, 2007, SAR amendment, all
outstanding options, including the performance options, are
classified as liabilities and are carried at their intrinsic value as
adjusted for vesting.