Rogers 2008 Annual Report Download - page 33
Download and view the complete annual report
Please find page 33 of the 2008 Rogers annual report below. You can navigate through the pages in the report by either clicking on the pages listed below, or by using the keyword search tool below to find specific information within the annual report.-
 1
1 -
2
-
3
-
4
-
5
-
6
-
7
-
8
-
9
-
10
-
11
-
12
-
13
-
14
-
15
-
16
-
17
-
18
-
19
-
20
-
21
-
22
-
 23
23 -
 24
24 -
 25
25 -
 26
26 -
 27
27 -
 28
28 -
 29
29 -
 30
30 -
 31
31 -
 32
32 -
 33
33 -
 34
34 -
 35
35 -
 36
36 -
 37
37 -
 38
38 -
 39
39 -
 40
40 -
 41
41 -
 42
42 -
 43
43 -
44
-
45
-
46
-
47
-
48
-
49
-
50
-
51
-
52
-
53
-
54
-
55
-
56
-
57
-
58
-
59
-
60
-
61
-
62
-
63
-
64
-
65
-
66
-
67
-
68
-
69
-
70
-
71
-
72
-
73
-
74
-
75
-
76
-
77
-
78
-
79
-
80
-
81
-
82
-
83
-
84
-
85
-
86
-
87
-
88
-
89
-
90
-
91
-
92
-
93
-
94
-
95
-
96
-
97
-
98
-
99
-
100
-
101
-
102
-
103
-
104
-
105
-
106
-
107
-
108
-
109
-
110
-
111
-
112
-
113
-
114
-
115
-
116
-
117
-
118
-
119
-
120
-
121
-
122
-
123
-
124
-
125
-
126
-
127
-
128
-
129
-
130
-
131
-
132
-
133
-
134
-
135
-
136
 |
 |

ROGERS COMMUNICATIONS INC. 2008 ANNUAL REPORT 29
MANAGEMENT’S DISCUSSION AND ANALYSIS OF FINANCIAL CONDITION AND RESULTS OF OPERATIONS
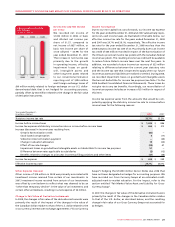
Net Income and Net Income
per Share
We recorded net income of
$1,002 million in 2008, or basic
and diluted net income per
share of $1.57, compared to
net income of $637 million, or
basic net income per share of
$1.00 (diluted – $0.99) for the
year ended December 31, 2007.
This increase in net income was
primarily due to the growth
in operating income, offset by
impairment losses on good-
will, intangible assets and
other long-term assets related
to our conventional television
reporting unit of $294 million
and foreign exchange losses of
$99 million mainly related to foreign exchange on our U.S. dollar-
denominated debt that is not hedged for accounting purposes,
partially offset by $64 million related to the change in the fair value
of derivative instruments.
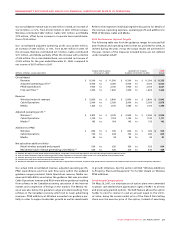
Income Tax Expense
Due to our non-capital loss carryforwards, our income tax expense
for the years ended December 31, 2008 and 2007 substantially repre-
sents non-cash income taxes. As illustrated in the table below, our
effective income tax rate for the years ended December 31, 2008
and 2007 was 29.7% and 28.1%, respectively. The effective income
tax rate for the year ended December 31, 2008 was less than the
2008 statutory income tax rate of 32.7% primarily due to an income
tax credit of $65 million recorded in respect of the harmonization of
the Ontario provincial income tax system with the Canadian federal
income tax system. The resulting income tax credit will be available
to reduce future Ontario income taxes over the next five years. In
addition, we recorded a future income tax recovery of $33 million
relating to differences between the current year statutory rate
and the income tax rate that is expected to apply when our future
income tax assets and liabilities are realized or settled. During 2008,
we recorded impairment losses on goodwill and intangible assets
that are not deductible for income tax purposes (see Note 7 to the
2008 Audited Consolidated Financial Statements). These losses do
not give rise to any tax benefits. Accordingly, our reconciliation of
income tax expense includes an increase of $51 million in respect of
this item.
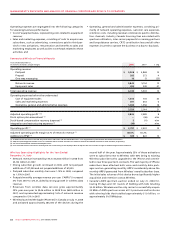
Income tax expense varies from the amounts that would be com-
puted by applying the statutory income tax rate to income before
income taxes for the following reasons:
Years ended December 31,
(In millions of dollars) 2008 2007
Statutory income tax rate 32.7% 35.2%
Income before income taxes $ 1,426 $ 886
Income tax expense at statutory income tax rate on income before income taxes $ 466 $ 312
Increase (decrease) in income taxes resulting from:
Ontario harmonization credit (65) –
Stock-based compensation 5 (17)
Vidéotron Ltée termination payment – (25)
Change in valuation allowance 19 (20)
Effect of tax rate changes (33) 47
Impairment losses on goodwill and intangible assets not deductible for income tax purposes 51 –
Difference between rates applicable to subsidiaries (2) (12)
Benefits related to changes to prior year income tax filing positions and other items (17) (36)
Income tax expense $ 424 $ 249
Effective income tax rate 29.7% 28.1%
Other Expense (Income)
Other income of $28 million in 2008 was primarily associated with
investment income received from certain of our investments. In
2007, investment income received from certain of our investments
was offset by a writedown to reflect what was deemed to be an
“other than temporary decline” in the value of an investment, and
certain other writedowns, resulting in a net expense of $4 million.
Change in Fair Value of Derivative Instruments
In 2008, the changes in fair value of the derivative instruments were
primarily the result of the impact of the changes in the value of
the Canadian dollar relative to that of the U.S. dollar related to the
cross-currency interest rate exchange agreements (“Cross-Currency
Swaps”) hedging the US$350 million Senior Notes due 2038 that
have not been designated as hedges for accounting purposes. We
have recorded our Cross-Currency Swaps at an estimated credit-
adjusted mark-to-market valuation. For the impact, refer to the
section entitled “Fair Market Value Asset and Liability for Cross-
Currency Swaps”.
In 2007, the changes in fair value of the derivative instruments were
primarily the result of the changes in the Canadian dollar relative
to that of the U.S. dollar, as described below, and the resulting
change in fair value of our Cross-Currency Swaps not accounted for
as hedges.
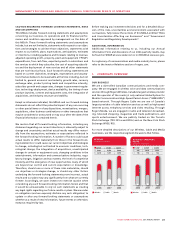
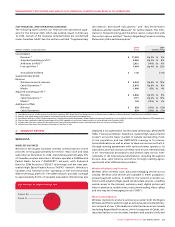
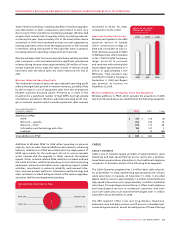
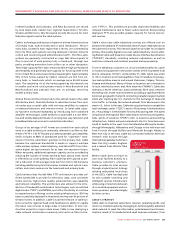
20082007
$1,260$1,066$684
CONSOLIDATED ADJUSTED
NET INCOME
(In millions of dollars)
200
7
2008
2006