Rogers 2008 Annual Report Download - page 113
Download and view the complete annual report
Please find page 113 of the 2008 Rogers annual report below. You can navigate through the pages in the report by either clicking on the pages listed below, or by using the keyword search tool below to find specific information within the annual report.-
 1
1 -
2
-
3
-
4
-
5
-
6
-
7
-
8
-
9
-
10
-
11
-
12
-
13
-
14
-
15
-
16
-
17
-
18
-
19
-
20
-
21
-
22
-
23
-
24
-
25
-
26
-
27
-
28
-
29
-
30
-
31
-
32
-
33
-
34
-
35
-
36
-
37
-
38
-
39
-
40
-
41
-
42
-
43
-
44
-
45
-
46
-
47
-
48
-
49
-
50
-
51
-
52
-
53
-
54
-
55
-
56
-
57
-
58
-
59
-
60
-
61
-
62
-
63
-
64
-
65
-
66
-
67
-
68
-
69
-
70
-
71
-
72
-
73
-
74
-
75
-
76
-
77
-
78
-
79
-
80
-
81
-
82
-
83
-
84
-
85
-
86
-
87
-
88
-
89
-
90
-
91
-
92
-
93
-
94
-
95
-
96
-
97
-
98
-
99
-
100
-
101
-
102
-
 103
103 -
 104
104 -
 105
105 -
 106
106 -
 107
107 -
 108
108 -
 109
109 -
 110
110 -
 111
111 -
 112
112 -
 113
113 -
 114
114 -
 115
115 -
 116
116 -
 117
117 -
 118
118 -
 119
119 -
 120
120 -
 121
121 -
 122
122 -
 123
123 -
124
-
125
-
126
-
127
-
128
-
129
-
130
-
131
-
132
-
133
-
134
-
135
-
136
 |
 |

ROGERS COMMUNICATIONS INC. 2008 ANNUAL REPORT 109
NOTES TO CONSOLIDATED FINANCIAL STATEMENTS
Carrying Contractual Less than 1 to 3 4 to 5 More than
amount cash flows 1 year years years 5 years
Bank advances, including outstanding cheques $ 19 $ 19 $ 19 $ – $ – $ –
Accounts payable and accrued liabilities 2,412 2,412 2,412 – – –
Bank credit facility 585 585 – – 585 –
Other long-term debt 7,910 7,910 1 1,235 1,923 4,751
Other long-term liabilities 184 184 4 81 43 56
Derivative instruments:
Cash outflow (Canadian dollar) 6,687 – 780 1,570 4,337
Cash inflow
(Canadian dollar equivalent of U.S. dollar) (6,796) – (612) (1,433)* (4,751)*
Net cash flows of derivative instruments 154 (109) – 168 137 (414)
$ 11,264 $ 11,001 $ 2,436 $ 1,484 $ 2,688 $ 4,393
*Represents Canadian dollar equivalent amount of U.S. dollar inflows matched to an equal amount of U.S. dollar maturities in “other long-term debt”.
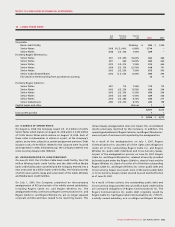
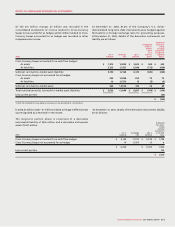
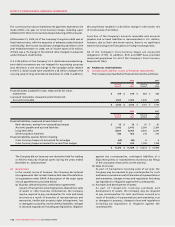
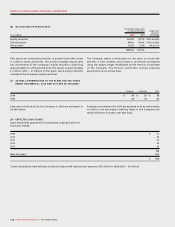
The following are the contractual maturities, excluding interest
payments, reflecting undiscounted disbursements of the Company’s
financial liabilities at December 31, 2008:
Less than 1 to 3 4 to 5 More than
1 year years years 5 years
Interest payments $ 618 $ 1,188 $ 797 $ 1,742
In addition to the amounts noted above, at December 31, 2008,
net interest payments over the life of the long-term debt and bank
credit facility, including derivative instruments, are:
(D) MARKET RISK:
Market risk is the risk that changes in market prices, such as
fluctuations in the market prices of the Company’s publicly traded
investments, the Company’s share price, foreign exchange rates
and interest rates, will affect the Company’s income or the value of
its financial instruments.
(i) Publicly traded investments:
The Company manages its risk related to fluctuations in the
market prices of its publicly traded investments by regularly
conducting financial reviews of publicly available information
related to its publicly traded investments to ensure that
any risks are within established levels of risk tolerance. The
Company does not routinely engage in risk management
practices such as hedging, derivatives or short selling with
respect to its publicly traded investments.
At December 31, 2008, a $1 change in the market price per
share of the Company’s publicly traded investments would
have resulted in an $8 million change in the Company’s other
comprehensive income, net of income taxes of $2 million.
(ii) Company’s share price:
In addition, market risk arises from accounting for the
Company’s stock-based compensation. All of the Company’s
outstanding stock options are classified as liabilities and
are carried at their intrinsic value, as adjusted for vesting,
measured as the difference between the current share price
and the option exercise price. The intrinsic value of the
liability is marked-to-market each period, and stock-based
compensation expense is impacted by the change in the price
of the Company’s Class B Non-Voting shares during the life of
the option. At December 31, 2008, a $1 change in the market
price of the Company’s Class B Non-Voting shares would have
resulted in a change of $7 million in net income, net of income
taxes of $3 million.
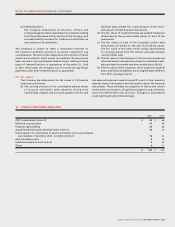
(iii) Foreign exchange and interest rates:
The Company uses derivative financial instruments to manage
risks from fluctuations in exchange rates and interest rates.
These instruments include Cross-Currency Swaps, and, from
time to time, interest rate exchange agreements, foreign
exchange forward contracts and foreign exchange option
agreements. All such agreements are only used for risk
management purposes.
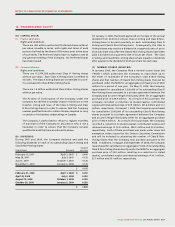
Effective August 6, 2008, in conjunction with the issuance of the
U.S. $1.4 billion Senior Notes due 2018, and the U.S. $350 million
Senior Notes due 2038, the Company entered into an aggregate
U.S. $1.75 billion notional principal amount of Cross-Currency Swaps.
An aggregate U.S. $1.4 billion notional principal amount of these
Cross-Currency Swaps hedge the principal and interest obligations
for the U.S. $1.4 billion Senior Notes due 2018 through to maturity
in 2018, while the remaining U.S. $350 million aggregate notional
principal amount of these Cross-Currency Swaps hedge the principal
and interest obligations on the $350 million Senior Notes due 2038
for 10 years to August 15, 2018. These Cross-Currency Swaps have
the effect of: (a) converting the U.S. $1.4 billion aggregate principal