Rogers 2008 Annual Report Download - page 48
Download and view the complete annual report
Please find page 48 of the 2008 Rogers annual report below. You can navigate through the pages in the report by either clicking on the pages listed below, or by using the keyword search tool below to find specific information within the annual report.
44 ROGERS COMMUNICATIONS INC. 2008 ANNUAL REPORT
MANAGEMENT’S DISCUSSION AND ANALYSIS OF FINANCIAL CONDITION AND RESULTS OF OPERATIONS
Rogers Home Phone Revenue
The revenue growth of Rogers Home Phone for 2008 reflects the
year-over-year growth in the cable telephony customer base, offset
by the ongoing decline of the circuit-switched and long-distance
only customer bases. The lower net additions of cable telephony
lines versus the previous year reflects the impact of a slowing
Ontario economy combined with increased win-back activities by
incumbent telecom providers as Rogers’ market share increases.
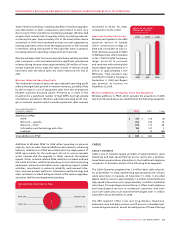
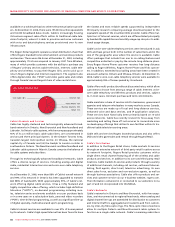
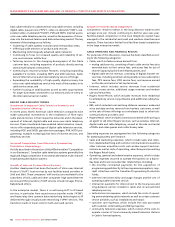
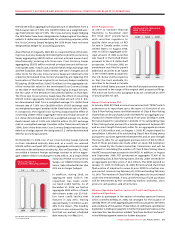
The base of cable telephony lines grew 28% from December 31, 2007
to December 31, 2008. At December 31, 2008, cable telephony lines
represented 36% of basic cable subscribers and 24% of the homes
passed by our cable networks.
Cable continues to focus principally on growing its on-net cable
telephony line base, and as part of this on-net focus, began to
significantly de-emphasize circuit-switched sales earlier in 2008
and intensified its efforts to convert circuit-switched lines that are
within the cable territory onto its cable telephony platform. Of
the 182,000 net line additions to cable telephony during the year,
approximately 60,000 were migrations of lines from our circuit-
switched to our cable telephony platform.
The greater number of circuit-switched net line losses during
2008 compared to 2007 reflect Cable’s migrations of lines within
the cable areas from the circuit-switched platform onto the cable
telephony platform, combined with a significant de-emphasis
since early 2008 on the sales and marketing of the lower margin
circuit-switched telephony product in markets outside of the cable
footprint. Because of the strategic decision to de-emphasize sales
of the circuit-switched telephony product outside of the cable
footprint, Cable expects that circuit-switched net line losses will
continue as that base of subscribers shrinks over time.
Internet (Residential) Revenue
The year-over-year increases in Internet revenues for 2008 primarily
reflect the 8% increase in the Internet subscriber base combined
with certain Internet services price increases made during the previ-
ous twelve months and incremental revenue from additional usage
charges. The average monthly revenue per Internet subscriber has
increased in 2008 compared to 2007 due to various pricing adjust-
ments over the prior year.
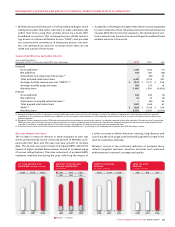
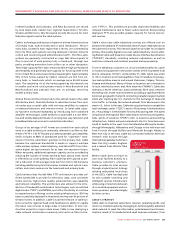
With the high-speed Internet base now at approximately 1.6 million,
Internet penetration is approximately 45% of the homes passed by
our cable networks.
In addition to the economic impacts on sales as discussed above,
the lower high-speed Internet net additions also reflect the grow-
ing penetration of broadband in Canada.
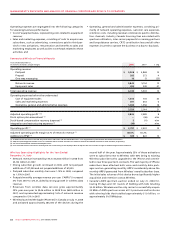
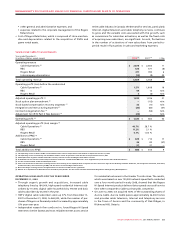
20082007
568361223
HIGH DEFINITION
HOUSEHOLDS
(In thousands)
2006
20082007
1,5821,4651,297
CABLE INTERNET SUBSCRIBERS
AND INTERNET PENETRATION
OF HOMES PASSED (In thousands)
2007
2008
2006
45%
41%
37%
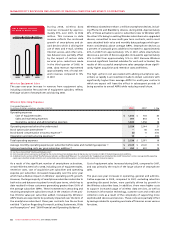
200820072006
2,3202,2952,277
Basic cable InternetDigital households
Residential cable telephony
1,5821,4651,297
1,5501,3531,134
840656366
CABLE RGUs
(In thousands)
200820072006
840656366
HOME PHONE CABLE TELEPHONY
SUBSCRIBERS AND PENETRATION
OF HOMES PASSED (In thousands)
24%
18%
11%
CABLE RGU BREAKDOWN
(%)
Telephony 13%
Digital 25%
High-speed Internet 25%
Basic 37%


