Rogers 2008 Annual Report Download - page 70
Download and view the complete annual report
Please find page 70 of the 2008 Rogers annual report below. You can navigate through the pages in the report by either clicking on the pages listed below, or by using the keyword search tool below to find specific information within the annual report.-
 1
1 -
2
-
3
-
4
-
5
-
6
-
7
-
8
-
9
-
10
-
11
-
12
-
13
-
14
-
15
-
16
-
17
-
18
-
19
-
20
-
21
-
22
-
23
-
24
-
25
-
26
-
27
-
28
-
29
-
30
-
31
-
32
-
33
-
34
-
35
-
36
-
37
-
38
-
39
-
40
-
41
-
42
-
43
-
44
-
45
-
46
-
47
-
48
-
49
-
50
-
51
-
52
-
53
-
54
-
55
-
56
-
57
-
58
-
59
-
 60
60 -
 61
61 -
 62
62 -
 63
63 -
 64
64 -
 65
65 -
 66
66 -
 67
67 -
 68
68 -
 69
69 -
 70
70 -
 71
71 -
 72
72 -
 73
73 -
 74
74 -
 75
75 -
 76
76 -
 77
77 -
 78
78 -
 79
79 -
 80
80 -
81
-
82
-
83
-
84
-
85
-
86
-
87
-
88
-
89
-
90
-
91
-
92
-
93
-
94
-
95
-
96
-
97
-
98
-
99
-
100
-
101
-
102
-
103
-
104
-
105
-
106
-
107
-
108
-
109
-
110
-
111
-
112
-
113
-
114
-
115
-
116
-
117
-
118
-
119
-
120
-
121
-
122
-
123
-
124
-
125
-
126
-
127
-
128
-
129
-
130
-
131
-
132
-
133
-
134
-
135
-
136
 |
 |

66 ROGERS COMMUNICATIONS INC. 2008 ANNUAL REPORT
MANAGEMENT’S DISCUSSION AND ANALYSIS OF FINANCIAL CONDITION AND RESULTS OF OPERATIONS
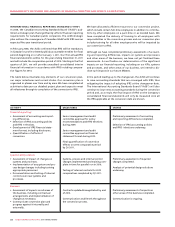
A Loss in Media’s Leadership Position in Radio, Television or
Magazine Readership Could Adversely Impact Media’s Sales
Volumes and Advertising Rates.
It is well established that advertising dollars migrate to media prop-
erties that are leaders in their respective markets and categories
when advertising budgets are tightened. Although most of Media’s
radio, television and magazine properties are currently leaders
in their respective markets, such leadership may not continue in
the future. Advertisers base a substantial part of their purchasing
decisions on statistics such as ratings and readership generated by
industry associations and agencies. If Media’s radio and television
ratings or magazine readership levels were to decrease substan-
tially, Media’s advertising sales volumes and the rates which it
charges advertisers could be adversely affected.
Changes in Technology Could Increase Competition.
The deployment of PVRs could influence Media’s capability to gener-
ate television advertising revenues as viewers are provided with the
opportunity to ignore advertising aired on the television networks.
The emergence of subscriber-based satellite and digital radio prod-
ucts could change radio audience listening habits and negatively
impact the results of Media’s radio stations. Certain audiences are
also migrating to the Internet as more video becomes available. In
addition, as mandated by the CRTC, Canadian television signals are
migrating to a strictly digital platform by August 31, 2011, which
could impact Media’s ability to reach certain audiences.
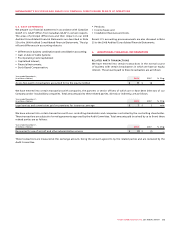
An Increase in Paper Prices, Printing Costs or Postage Could
Adversely Affect Media’s Results of Operations.
A significant portion of Publishing’s operating expenses consists of
paper, printing and postage expenses. Paper is Publishing’s single
largest raw material expense, representing approximately 7% of
Publishing’s operating expenses in 2008. Publishing depends upon
outside suppliers for all of its paper supplies, holds relatively small
quantities of paper in stock itself, and is unable to control paper
prices, which can fluctuate considerably. Moreover, Publishing
is generally unable to pass paper cost increases on to customers.
Printing costs represented approximately 13% of Publishing’s oper-
ating expenses in 2008. Publishing relies on third parties for all of
its printing services. In addition, Publishing relies on the Canadian
Postal Service to distribute a large percentage of its publications.
Any disruption in printing or postage services could have a material
impact on Media’s results of operations or financial condition. A
material increase in paper prices, printing costs or postage expenses
to Publishing could have a material adverse effect on Media’s busi-
ness, results of operations or financial condition.
5. ACCOUNTING POLICIES AND NON-GAAP MEASURES
KEY PERFORMANCE INDICATORS AND NON-GAAP MEASURES
We measure the success of our strategies using a number of key
performance indicators, which are outlined below. The following
key performance indicators are not measurements in accordance
with Canadian or U.S. GAAP and should not be considered as an
alternative to net income or any other measure of performance
under Canadian or U.S. GAAP.
Subscriber Counts
We determine the number of subscribers to our services based on
active subscribers. A wireless subscriber is represented by each
identifiable telephone number. A cable subscriber is represented
by a dwelling unit. In the case of multiple units in one dwelling,
such as an apartment building, each tenant with cable service,
whether invoiced individually or having services included in his or
her rent, is counted as one subscriber. Commercial or institutional
units, such as hospitals or hotels, are each considered to be one
subscriber. When subscribers are deactivated, either voluntarily or
involuntarily for non-payment, they are considered to be deactiva-
tions in the period the services are discontinued. Wireless prepaid
subscribers are considered active for a period of 180 days from the
date of their last revenue-generating usage.
We report wireless subscribers in two categories: postpaid and
prepaid. Postpaid includes voice-only and data-only subscribers,
as well as subscribers with service plans integrating both voice and
data, while prepaid includes voice-only subscribers.
Internet, Rogers Home Phone and RBS subscribers include only
those subscribers with service installed, operating and on billing
and excludes those subscribers who have subscribed to the service
but for whom installation of the service was still pending.
Subscriber Churn
Subscriber churn is calculated on a monthly basis. For any partic-
ular month, subscriber churn for Wireless represents the number
of subscribers deactivating in the month divided by the aggregate
number of subscribers at the beginning of the month. When used
or reported for a period greater than one month, subscriber churn
represents the monthly average of the subscriber churn for the
period.
Average Revenue Per User
ARPU is calculated on a monthly basis. For any particular month,
ARPU represents monthly revenue divided by the average number
of subscribers during the month. In the case of Wireless, ARPU rep-
resents monthly network revenue divided by the average number
of subscribers during the month. ARPU, when used in connection
with a particular type of subscriber, represents monthly revenue
generated from those subscribers divided by the average number
of those subscribers during the month. When used or reported for
a period greater than one month, ARPU represents the monthly
average of the ARPU calculations for the period. We believe ARPU
helps indicate whether we have been successful in attracting and
retaining higher value subscribers. Refer to the section entitled
“Supplementary Information: Non-GAAP Calculations” for further
details on this Wireless and Cable calculation.
Operating Expenses
Operating expenses are segregated into three categories for assess-
ing business performance:
• Costofsales,whichiscomprisedofwirelessequipmentcosts,
Rogers Retail merchandise and depreciation of Rogers Retail
rental assets, as well as cost of goods sold by The Shopping
Channel;