Rogers 2006 Annual Report Download - page 95
Download and view the complete annual report
Please find page 95 of the 2006 Rogers annual report below. You can navigate through the pages in the report by either clicking on the pages listed below, or by using the keyword search tool below to find specific information within the annual report.-
 1
1 -
2
-
3
-
4
-
5
-
6
-
7
-
8
-
9
-
10
-
11
-
12
-
13
-
14
-
15
-
16
-
17
-
18
-
19
-
20
-
21
-
22
-
23
-
24
-
25
-
26
-
27
-
28
-
29
-
30
-
31
-
32
-
33
-
34
-
35
-
36
-
37
-
38
-
39
-
40
-
41
-
42
-
43
-
44
-
45
-
46
-
47
-
48
-
49
-
50
-
51
-
52
-
53
-
54
-
55
-
56
-
57
-
58
-
59
-
60
-
61
-
62
-
63
-
64
-
65
-
66
-
67
-
68
-
69
-
70
-
71
-
72
-
73
-
74
-
75
-
76
-
77
-
78
-
79
-
80
-
81
-
82
-
83
-
84
-
 85
85 -
 86
86 -
 87
87 -
 88
88 -
 89
89 -
 90
90 -
 91
91 -
 92
92 -
 93
93 -
 94
94 -
 95
95 -
 96
96 -
 97
97 -
 98
98 -
 99
99 -
 100
100 -
 101
101 -
 102
102 -
 103
103 -
 104
104 -
 105
105 -
106
-
107
-
108
-
109
-
110
-
111
-
112
-
113
-
114
-
115
-
116
-
117
-
118
-
119
-
120
 |
 |

91
RO GER S CO MMU NIC AT ION S IN C . 20 0 6 ANN UA L RE POR T
NOTES TO CONSOLIDATED FINANCIAL STATEMENTS
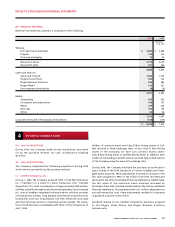
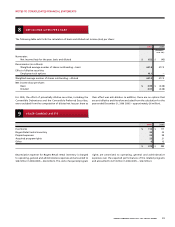
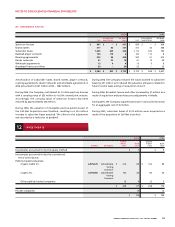
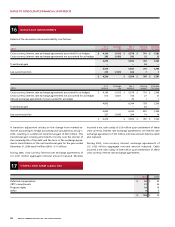
8 NET INCOME (LO SS) PER SHA RE
The following table sets forth the calculation of basic and diluted net income (loss) per share:
2006 2005
(Restated –
note 2(b))
Numerator:
Net income (loss) for the year, basic and diluted $ 622 $ (45)
Denominator (in millions):
Weighted average number of shares outstanding – basic 631.8 577.3
Effect of dilutive securities:
Employee stock options 10.1 –
Weighted average number of shares outstanding – diluted 641.9 577.3
Net income (loss) per share:
Basic $ 0.99 $ (0.08)
Diluted 0.97 (0.08)
their effect was anti-dilutive. In addition, there are no options that
are anti-dilutive and therefore excluded from the calculation for the
year ended December 31, 2006 (2005 – approximately 26 million).
For 2005, the effect of potentially dilutive securities, including the
Convertible Debentures and the Convertible Preferred Securities,
were excluded from the computation of diluted net loss per share as
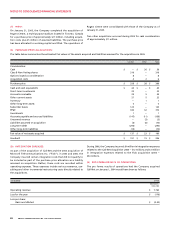
9 OTH ER CURRENT ASSE TS
2006 2005
Inventories $ 113 $ 117
Rogers Retail rental inventory 35 35
Prepaid expenses 93 99
Acquired program rights 23 21
Other 6 13
$ 270 $ 285
Depreciation expense for Rogers Retail rental inventory is charged
to operating, general and administrative expenses and amounted to
$48 million in 2006 (2005 – $64 million). The costs of acquired program
rights are amortized to operating, general and administrative
expenses over the expected performances of the related programs
and amounted to $27 million in 2006 (2005 – $26 million).