Rogers 2006 Annual Report Download - page 89
Download and view the complete annual report
Please find page 89 of the 2006 Rogers annual report below. You can navigate through the pages in the report by either clicking on the pages listed below, or by using the keyword search tool below to find specific information within the annual report.-
 1
1 -
2
-
3
-
4
-
5
-
6
-
7
-
8
-
9
-
10
-
11
-
12
-
13
-
14
-
15
-
16
-
17
-
18
-
19
-
20
-
21
-
22
-
23
-
24
-
25
-
26
-
27
-
28
-
29
-
30
-
31
-
32
-
33
-
34
-
35
-
36
-
37
-
38
-
39
-
40
-
41
-
42
-
43
-
44
-
45
-
46
-
47
-
48
-
49
-
50
-
51
-
52
-
53
-
54
-
55
-
56
-
57
-
58
-
59
-
60
-
61
-
62
-
63
-
64
-
65
-
66
-
67
-
68
-
69
-
70
-
71
-
72
-
73
-
74
-
75
-
76
-
77
-
78
-
 79
79 -
 80
80 -
 81
81 -
 82
82 -
 83
83 -
 84
84 -
 85
85 -
 86
86 -
 87
87 -
 88
88 -
 89
89 -
 90
90 -
 91
91 -
 92
92 -
 93
93 -
 94
94 -
 95
95 -
 96
96 -
 97
97 -
 98
98 -
 99
99 -
100
-
101
-
102
-
103
-
104
-
105
-
106
-
107
-
108
-
109
-
110
-
111
-
112
-
113
-
114
-
115
-
116
-
117
-
118
-
119
-
120
 |
 |

85
RO GER S CO MMU NIC AT ION S IN C . 20 0 6 ANN UA L RE POR T
NOTES TO CONSOLIDATED FINANCIAL STATEMENTS
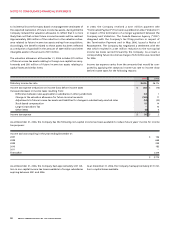
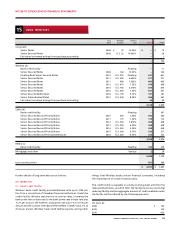
3 SEG MENTED INFO RMAT ION
(A) OPER ATING SEGMENTS:
All of the Company’s reportable segments are substantially in Canada. Information by reportable segment for the years ended December 31,
2006 and 2005 is as follows:
2006 2005
Cable Corporate Cable Corporate
and items and Consolidated and items and Consolidated
Wireless Telecom Media eliminations totals Wireless Telecom Media eliminations totals
(Restated – (Restated –
note 2(b)) note 2(b))
Operating revenue $ 4,580 $ 3,201 $ 1,210 $ (153) $ 8,838 $ 3,860 $ 2,492 $ 1,097 $ (115) $ 7,334
Cost of sales 628 153 175 – 956 625 158 157 – 940
Sales and marketing
expenses 604 412 206 4 1,226 604 320 198 – 1,122
Operating, general
and administrative
expenses 1,376 1,731 678 (22) 3,763 1,240 1,244 614 (36) 3,062
Integration and store
closure expenses 3 15 – – 18 54 5 – 7 66
1,969 890 151 (135) 2,875 1,337 765 128 (86) 2,144
Management fees
(recovery) 12 64 17 (93) – 12 41 15 (68) –
1,957 826 134 (42) 2,875 1,325 724 113 (18) 2,144
Depreciation and
amortization 630 662 52 240 1,584 624 558 52 255 1,489
Operating income
(loss) 1,327 164 82 (282) 1,291 701 166 61 (273) 655
Interest:
Long-term debt (398) (223) (14) 15 (620) (397) (249) (9) (44) (699)
Intercompany 89 (35) (2) (52) – 37 (24) (4) (9) –
Foreign exchange
gain (loss) 1 1 – – 2 26 12 1 (4) 35
Gain (loss) on
repayment of
long-term debt – – – (1) (1) – (27) – 16 (11)
Change in fair value
of derivative
instruments (5) 1 – – (4) (27) 2 – – (25)
Other income
(expense) (2) – 6 6 10 (6) 3 1 4 2
Income tax reduction
(expense) (274) 269 68 (119) (56) 84 (5) 14 (95) (2)
Net income (loss)
for the year $ 738 $ 177 $ 140 $ (433) $ 622 $ 418 $ (122) $ 64 $ (405) $ (45)
Additions to PP&E $ 684 $ 794 $ 48 $ 186 $ 1,712 $ 585 $ 714 $ 40 $ 16 $ 1,355
Goodwill $ 1,150 $ 926 $ 703 $ – $ 2,779 $ 1,212 $ 1,118 $ 706 $ – $ 3,036
Total assets $ 7,471 $ 5,216 $ 1,459 $ (41) $ 14,105 $ 8,793 $ 4,627 $ 1,321 $ (907) $ 13,834