Rogers 2006 Annual Report Download - page 44
Download and view the complete annual report
Please find page 44 of the 2006 Rogers annual report below. You can navigate through the pages in the report by either clicking on the pages listed below, or by using the keyword search tool below to find specific information within the annual report.-
 1
1 -
2
-
3
-
4
-
5
-
6
-
7
-
8
-
9
-
10
-
11
-
12
-
13
-
14
-
15
-
16
-
17
-
18
-
19
-
20
-
21
-
22
-
23
-
24
-
25
-
26
-
27
-
28
-
29
-
30
-
31
-
32
-
33
-
 34
34 -
 35
35 -
 36
36 -
 37
37 -
 38
38 -
 39
39 -
 40
40 -
 41
41 -
 42
42 -
 43
43 -
 44
44 -
 45
45 -
 46
46 -
 47
47 -
 48
48 -
 49
49 -
 50
50 -
 51
51 -
 52
52 -
 53
53 -
 54
54 -
55
-
56
-
57
-
58
-
59
-
60
-
61
-
62
-
63
-
64
-
65
-
66
-
67
-
68
-
69
-
70
-
71
-
72
-
73
-
74
-
75
-
76
-
77
-
78
-
79
-
80
-
81
-
82
-
83
-
84
-
85
-
86
-
87
-
88
-
89
-
90
-
91
-
92
-
93
-
94
-
95
-
96
-
97
-
98
-
99
-
100
-
101
-
102
-
103
-
104
-
105
-
106
-
107
-
108
-
109
-
110
-
111
-
112
-
113
-
114
-
115
-
116
-
117
-
118
-
119
-
120
 |
 |

40 R OGE RS C OMM UNI C ATIO N S I N C . 2 0 0 6 AN NUAL R EPOR T
MANAGEMENT’S DISCUSSION AND ANALYSIS
OF FINANCIAL CONDITION AND RESULTS OF OPERATIONS
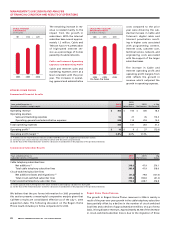
The increase in long distance revenue resulted from an increase in
volume of 11% over 2005. Approximately 82% of the increase in long
distance volume relates to increases in the intercompany sale of
long distance to Wireless. The volume increases were partially off-
set by the ongoing decline in average revenue per minute, which
decreased 6% in 2006.
RBS continues to focus on selling local and data products, especially
IP-enabled solutions, thereby decreasing its reliance on long distance
revenues. The combination of local and data revenue represented
56% of total revenue for 2006, with the growth in local and data rev-
enue being offset by the declines in long distance revenue, excluding
transactions with Wireless.
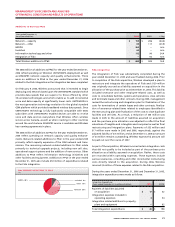
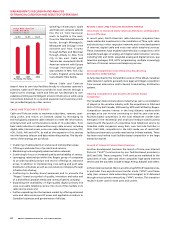
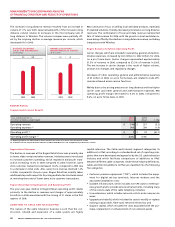
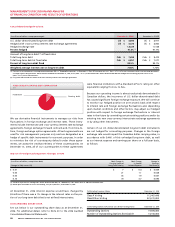
Rogers Business Solutions Operating Profit
Carrier charges, which are included in operating, general and admin-
istrative expenses, increased by $43 million to $342 million for 2006,
on a pro forma basis. Carrier charges represented approximately
57.5% of revenue in 2006, compared to 53.3% of revenue in 2005.
The net increase in carrier charges is the result of higher volume,
product mix changes, and regulatory changes.
Decreases of other operating, general and administrative expenses
of $3 million in 2006, on a pro forma basis, are related to scale effi-
ciencies achieved across various functions.
Mainly due to the pricing pressures on long distance and the higher
carrier costs and other general and administrative expenses, RBS
operating profit margin decreased to 8.2% in 2006, compared to
9.6%, on a pro forma basis, in 2005.
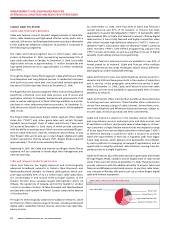
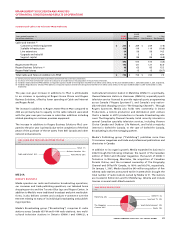
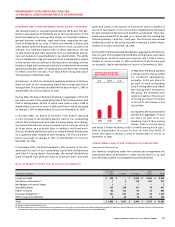
20062005
205172
BUSINESS SOLUTIONS
LOCAL LINE EQUIVALENTS
(In thousands)
20062005
3122
BUSINESS SOLUTIONS
BROADBAND DATA CIRCUITS
(In thousands)
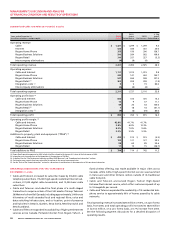
ROGERS RETAIL
Summarized Financial Results
Years ended December 31, 2006 2005
(In millions of dollars, except margin) Actual Actual % Chg
Operating revenue $ 310 $ 327 (5.2)
Operating expenses (1) 303 309 (1.9)
Operating profit (2) $ 7 $ 18 (61.1)
Operating profit margin (2) 2.3% 5.5%
(1) Operating expenses for 2006 include $6 million related to the closure of 21 stores in the first quarter of 2006.
(2) As defined. See the “Key Performance Indicators and Non-GAAP Measures” and “Supplementary Information” sections.
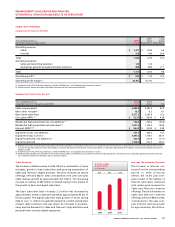
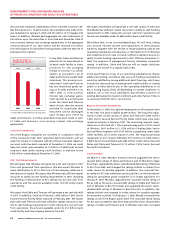
Rogers Retail Revenue
The decline in revenues at the Rogers Retail stores was primarily due
to lower video rental and sales revenues. Initiatives were introduced
to increase customers’ spending, which resulted in dollars per trans-
action increasing 13.0% in 2006 compared to 2005; however, same
store customer transactions decreased 12.6%, compared to 2005 due
to a decrease in total visits. Also, same store revenue declined 1.2%
in 2006, compared to the prior year. Rogers Retail has recently taken
additional steps with respect to its pricing and late-fee structures aimed
at reversing the trend of lower same store customer transactions.
Rogers Retail Operating Expenses and Operating Profit
The year-over-year decline in Rogers Retail operating profit relates
primarily to the decline in revenues and charges of approximately
$6 million in 2006 associated with the closing of 21 stores in the first
quarter of 2006.
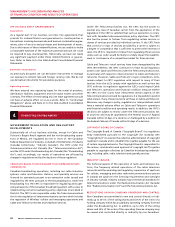
ADDITIONS TO C ABLE AND TELECOM PP&E
The nature of the cable television business is such that the con-
struction, rebuild and expansion of a cable system are highly
capital-intensive. The Cable and Internet segment categorizes its
additions to PP&E according to a standardized set of reporting cate-
gories that were developed and agreed to by the U.S. cable television
industry and which facilitate comparisons of additions to PP&E
between different cable companies. Under these industry definitions,
Cable and Internet additions to PP&E are classified into the following
five categories:
• Customer premises equipment (“CPE”), which includes the equip-
ment for digital set-top terminals, Internet modems and the
associated installation costs;
• Scalable infrastructure, which includes non-CPE costs to meet busi-
ness growth and to provide service enhancements, including many
of the costs to-date of the cable telephony initiative;
• Line extensions, which includes network costs to enter new service
areas;
• Upgrade and rebuild, which includes the costs to modify or replace
existing coaxial cable, fibre-optic network electronics; and
• Support capital, which includes the costs associated with the pur-
chase, replacement or enhancement of non-network assets.