Rogers 2006 Annual Report Download - page 25
Download and view the complete annual report
Please find page 25 of the 2006 Rogers annual report below. You can navigate through the pages in the report by either clicking on the pages listed below, or by using the keyword search tool below to find specific information within the annual report.-
 1
1 -
2
-
3
-
4
-
5
-
6
-
7
-
8
-
9
-
10
-
11
-
12
-
13
-
14
-
 15
15 -
 16
16 -
 17
17 -
 18
18 -
 19
19 -
 20
20 -
 21
21 -
 22
22 -
 23
23 -
 24
24 -
 25
25 -
 26
26 -
 27
27 -
 28
28 -
 29
29 -
 30
30 -
 31
31 -
 32
32 -
 33
33 -
 34
34 -
 35
35 -
36
-
37
-
38
-
39
-
40
-
41
-
42
-
43
-
44
-
45
-
46
-
47
-
48
-
49
-
50
-
51
-
52
-
53
-
54
-
55
-
56
-
57
-
58
-
59
-
60
-
61
-
62
-
63
-
64
-
65
-
66
-
67
-
68
-
69
-
70
-
71
-
72
-
73
-
74
-
75
-
76
-
77
-
78
-
79
-
80
-
81
-
82
-
83
-
84
-
85
-
86
-
87
-
88
-
89
-
90
-
91
-
92
-
93
-
94
-
95
-
96
-
97
-
98
-
99
-
100
-
101
-
102
-
103
-
104
-
105
-
106
-
107
-
108
-
109
-
110
-
111
-
112
-
113
-
114
-
115
-
116
-
117
-
118
-
119
-
120
 |
 |

21
RO GER S CO MMU NIC AT ION S IN C . 20 0 6 ANN UA L RE POR T
MANAGEMENT’S DISCUSSION AND ANALYSIS
OF FINANCIAL CONDITION AND RESULTS OF OPERATIONS
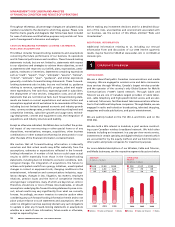
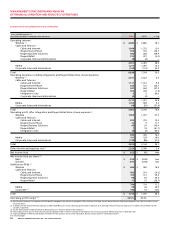
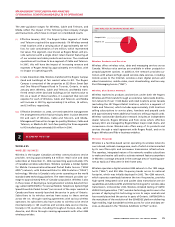
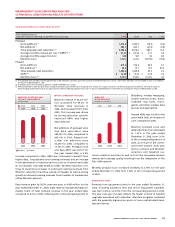
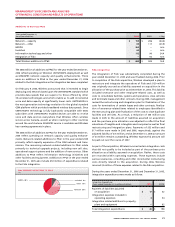
Our consolidated revenue was $8,838 million in 2006, an increase of
$1,504 million, or 20.5%, from $7,334 million in 2005. Of the increase,
Wireless contributed $720 million, Cable and Telecom $709 million,
and Media $113 million, offset by an increase in corporate items and
eliminations of $38 million.
Our consolidated operating profit was $2,875 million, an increase of
$731 million, or 34.1%, from $2,144 million in 2005. Of this increase,
Wireless contributed $632 million, Cable and Telecom contributed
$125 million, and Media contributed $23 million. Consolidated
operating profit as a percentage of operating revenue (“operating
profit margin”) increased to 32.5% in 2006 from 29.2% in 2005. On
a consolidated basis, we recorded net income of $622 million for
the year ended December 31, 2006, as compared to a net loss of
$45 million in 2005.
Refer to the respective individual segment discussions for details of
the revenue, operating expenses, operating profit and additions to
PP&E of Wireless, Cable and Telecom, and Media.
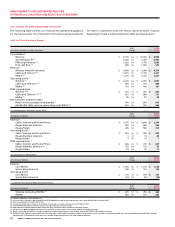
2006 Performance Against Targets
The following table sets forth the guidance ranges for selected full
year financial and operating metrics that we provided for 2006, as
revised during the year, versus the actual results we achieved for the
year. As indicated in the table, we either met or exceeded our oper-
ating and financial targets in all categories.
Ori gina l 2006 Gu idan ce Updates from 2006
(In millions of dollars, except subscribers) (At February 9, 2006) Original Guidance Actual
Revenue
Wireless (network revenue) $ 4,125 to $ 4,175 $ 4,125 to $ 4,300 $ 4,313
Cable and Telecom 3,110 to 3,185 3,110 to 3,217 3,201
Media 1,165 to 1,205 1,165 to 1,205 1,210
Operating profit (1)
Wireless (2) $ 1,730 to $ 1,780 $ 1,730 to $ 1,905 $ 1,997
Cable and Telecom (3) 825 to 860 825 to 877 899
Media 115 to 120 115 to 130 151
PP&E expenditures (4)
Wireless $ 600 to $ 650 $ 600 to $ 650 $ 624
Cable and Telecom 640 to 695 640 to 751 751
Net subscriber additions (000s)
Retail wireless postpaid and prepaid 525 to 575 525 to 575 610
Basic cable 0 to 10 0 to 10 13
Digital households 175 to 225 175 to 225 221
High-speed Internet 125 to 175 125 to 175 155
Residential cable telephony 200 to 250 200 to 300 318
Rogers Telecom integration $ 50 to $ 65 $ 50 to $ 65 $ 52
(1) Before RCI corporate expenses and management fees paid to RCI.
(2) Excludes operating losses related to the Inukshuk fixed wireless initiative and costs associated with the integration of Fido Solutions Inc. (“Fido”).
(3) Excludes costs associated with the integration of Call-Net.
(4) Does not include Corporate, Inukshuk or Media PP&E expenditures or the PP&E expenditures related to the Call-Net integration.