Rogers 2006 Annual Report Download - page 34
Download and view the complete annual report
Please find page 34 of the 2006 Rogers annual report below. You can navigate through the pages in the report by either clicking on the pages listed below, or by using the keyword search tool below to find specific information within the annual report.-
 1
1 -
2
-
3
-
4
-
5
-
6
-
7
-
8
-
9
-
10
-
11
-
12
-
13
-
14
-
15
-
16
-
17
-
18
-
19
-
20
-
21
-
22
-
23
-
 24
24 -
 25
25 -
 26
26 -
 27
27 -
 28
28 -
 29
29 -
 30
30 -
 31
31 -
 32
32 -
 33
33 -
 34
34 -
 35
35 -
 36
36 -
 37
37 -
 38
38 -
 39
39 -
 40
40 -
 41
41 -
 42
42 -
 43
43 -
 44
44 -
45
-
46
-
47
-
48
-
49
-
50
-
51
-
52
-
53
-
54
-
55
-
56
-
57
-
58
-
59
-
60
-
61
-
62
-
63
-
64
-
65
-
66
-
67
-
68
-
69
-
70
-
71
-
72
-
73
-
74
-
75
-
76
-
77
-
78
-
79
-
80
-
81
-
82
-
83
-
84
-
85
-
86
-
87
-
88
-
89
-
90
-
91
-
92
-
93
-
94
-
95
-
96
-
97
-
98
-
99
-
100
-
101
-
102
-
103
-
104
-
105
-
106
-
107
-
108
-
109
-
110
-
111
-
112
-
113
-
114
-
115
-
116
-
117
-
118
-
119
-
120
 |
 |
30 ROG E RS COM MUN I C AT I ONS INC . 2006 A NNUAL REP ORT
MANAGEMENT’S DISCUSSION AND ANALYSIS
OF FINANCIAL CONDITION AND RESULTS OF OPERATIONS
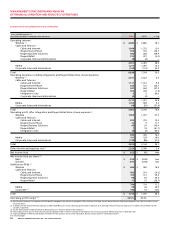
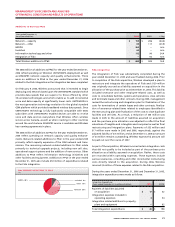
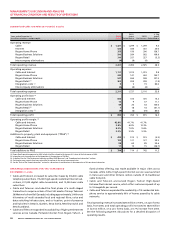
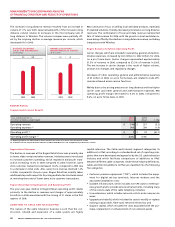
Wireless Operating Expenses
Years ended December 31,
(In millions of dollars, except per subscriber statistics) 2006 2005 % Chg
Operating expenses
Cost of equipment sales (1) $ 628 $ 625 0.5
Sales and marketing expenses 604 604 –
Operating, general and administrative expenses 1,376 1,240 11.0
Integration expenses (2) 3 54 (94.4)
Total operating expenses $ 2,611 $ 2,523 3.5
Average monthly operating expense per
subscriber before sales and marketing expenses (3) $ 19.69 $ 20.78 (5.2)
Sales and marketing costs per gross
subscriber addition (3) $ 399 $ 388 2.8
(1) Certain current and prior year amounts related to equipment sales and cost of equipment sales have been reclassified. See the “Reclassification of Wireless Equipment Sales and Cost of Sales” section.
(2) Expenses incurred related to the integration of the operations of Fido.
(3) Includes integration expenses for respective periods. As defined. See the “Key Performance Indicators and Non-GAAP Measures” section. As calculated in the “Supplementary Information” section.
Cost of equipment sales increased by $3 million for the year ended
2006 compared to 2005. The increase reflects the growing volume
of handset upgrades associated with subscriber retention programs
combined with generally higher price points of more sophisticated
handsets and devices.
Sales and marketing expenses of $604 million in 2006 were similar
in amount to 2005. Wireless’ marketing efforts during 2006 included
targeted programs to acquire high value customers on longer term
contracts, including several successful handset campaigns, result-
ing in increases in the sales and marketing costs per gross addition.
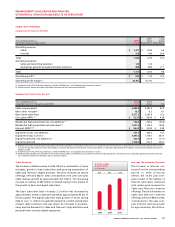
Operating, general and administrative expenses increased by
$136 million for the year ended 2006, compared to the corresponding
period of 2005. The increase is a result of increases in retention spend-
ing and growth in network operating expenses to accommodate the
growth in Wireless’ subscriber base and usage. These increased costs
were partially offset by savings related to more favourable roam-
ing arrangements and operating and scale efficiencies across various
functions.
Total retention spending (including subsidies on handset upgrades)
was $321 million for the year ended 2006, compared to $288 million
in the corresponding period in 2005. Retention spending, on both
an absolute and a per subscriber basis, is expected to continue to
grow as wireless market penetration in Canada deepens and WNP
becomes available in March 2007 as mandated by the CRTC.
Wireless incurred $3 million during the year for integration expenses
associated with the Fido acquisition. These integration expenses
have been recorded within operating expenses. See the section
below entitled “Fido Integration” for more details on integration
costs incurred.
The 5.2% year-over-year decrease in average monthly operating
expense per subscriber, excluding sales and marketing expenses
and including integration expenses, primarily reflects operating and
scale efficiencies across various functions.
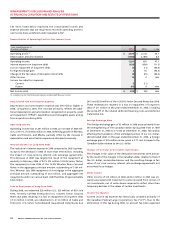
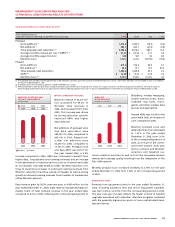
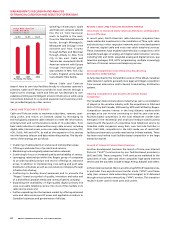
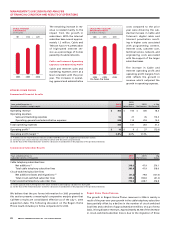
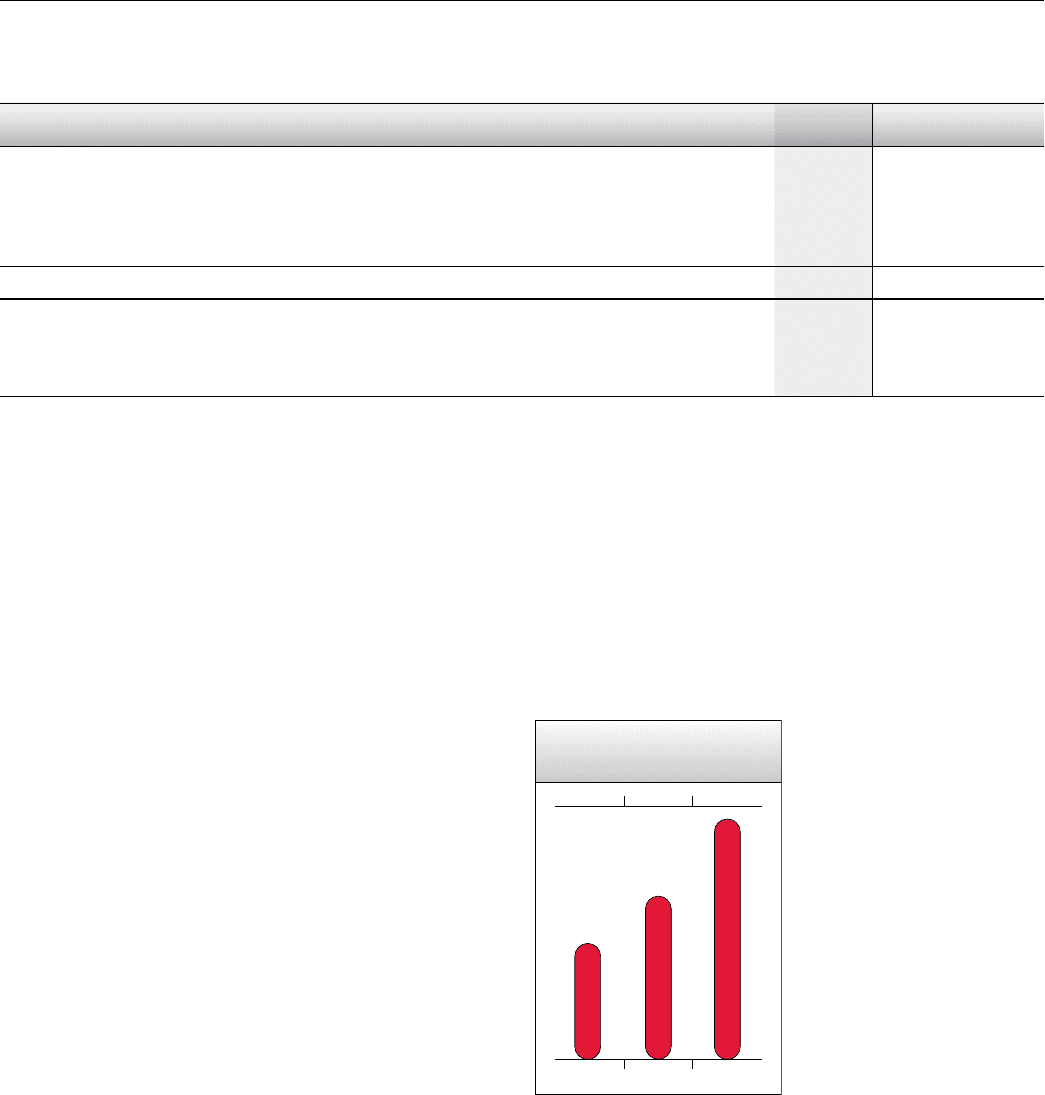
Wireless Operating Profit
Operating profit grew by $632
mil lion, or 47.3%, to $1,969 mil-
lion in the year ended December
31, 2006 from $1,337 mil lion in
the corresponding period of
2005, due to the strong net-
work revenue growth of 19.3%
which exceeded the growth in
operating expenses of 3.5%.
200620052004
$1,969$1,337$950
WIRELESS
OPERATING PROFIT
(In millions of dollars)