Rogers 2006 Annual Report Download - page 28
Download and view the complete annual report
Please find page 28 of the 2006 Rogers annual report below. You can navigate through the pages in the report by either clicking on the pages listed below, or by using the keyword search tool below to find specific information within the annual report.-
 1
1 -
2
-
3
-
4
-
5
-
6
-
7
-
8
-
9
-
10
-
11
-
12
-
13
-
14
-
15
-
16
-
17
-
 18
18 -
 19
19 -
 20
20 -
 21
21 -
 22
22 -
 23
23 -
 24
24 -
 25
25 -
 26
26 -
 27
27 -
 28
28 -
 29
29 -
 30
30 -
 31
31 -
 32
32 -
 33
33 -
 34
34 -
 35
35 -
 36
36 -
 37
37 -
 38
38 -
39
-
40
-
41
-
42
-
43
-
44
-
45
-
46
-
47
-
48
-
49
-
50
-
51
-
52
-
53
-
54
-
55
-
56
-
57
-
58
-
59
-
60
-
61
-
62
-
63
-
64
-
65
-
66
-
67
-
68
-
69
-
70
-
71
-
72
-
73
-
74
-
75
-
76
-
77
-
78
-
79
-
80
-
81
-
82
-
83
-
84
-
85
-
86
-
87
-
88
-
89
-
90
-
91
-
92
-
93
-
94
-
95
-
96
-
97
-
98
-
99
-
100
-
101
-
102
-
103
-
104
-
105
-
106
-
107
-
108
-
109
-
110
-
111
-
112
-
113
-
114
-
115
-
116
-
117
-
118
-
119
-
120
 |
 |

24 ROG ERS COM MUN ICAT I ONS INC . 2006 ANN UAL RE P ORT
MANAGEMENT’S DISCUSSION AND ANALYSIS
OF FINANCIAL CONDITION AND RESULTS OF OPERATIONS
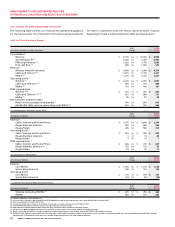
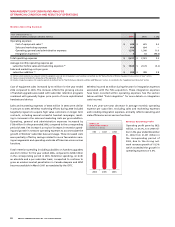
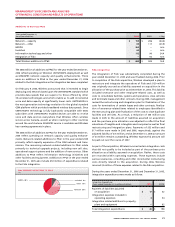
2007 Full Year Guidance Ranges
200 7 2006
(In millions of dollars, except subscribers) Range Actual
Consolidated
Revenue $ 9,700 to $ 10,000 $ 8,838
Operating profit (1) 3,250 to 3,400 2,887
PP&E expenditures (1) 1,625 to 1,750 1,669
Free cash flow (2) 800 to 1,000 543
Revenue
Wireless (network revenue) $ 4,900 to $ 5,000 $ 4,313
Cable and Telecom (A) 3,615 to 3,700 3,201
Media (B) 1,275 to 1,325 1,210
Operating profit (3)
Wireless (4) $ 2,250 to $ 2,350 $ 1,997
Cable and Telecom (A)(1) 935 to 975 899
Media (B) 150 to 160 151
PP&E expenditures
Wireless (C)(5) $ 675 to $ 725 $ 624
Cable and Telecom (A)(1)(6) 815 to 880 751
Media (7) 85 to 95 48
Net subscriber additions (000s)
Retail wireless postpaid and prepaid (8) 500 to 600 610
Residential cable revenue generating units (RGUs) (9) 625 to 725 666
(A) Supplementary Cable and Telecom detail:
200 7 2006
(In millions of dollars) Range Actual
Revenue
Cable, Internet and Home Phone $ 2,570 to $ 2,600 $ 2,299
Rogers Business Solutions 560 to 600 596
Rogers Retail 485 to 500 310
Operating profit (1)
Cable, Internet and Home Phone $ 925 to $ 950 $ 843
Rogers Business Solutions 5 to 15 49
Rogers Retail 5 to 10 7
PP&E expenditures (1)
Cable, Internet and Home Phone $ 665 to $ 700 $ 657
Rogers Business Solutions (6) 125 to 150 83
Rogers Retail 25 to 30 11
(B) Supplementary Media detail:
200 7 2006
(In millions of dollars) Range Actual
Revenue
Core Media $ 1,095 to $ 1,135 $ 1,034
Sports Entertainment 180 to 190 176
Operating profit
Core Media $ 175 to $ 190 $ 167
Sports Entertainment (25) to (30) (16)
(C) Supplementary Wireless PP&E expenditures detail:
200 7 2006
(In millions of dollars) Range Actual
Wireless (excluding HSDPA) (5) $ 425 to $ 450 $ 360
HSDPA 250 to 275 264
(1) Excludes integration related expenditures.
(2) Free cash flow is defined as operating profit less PP&E expenditures and interest expense and is not a term defined under Canadian GAAP.
(3) Before management fees paid to RCI in 2006.
(4) Excludes operating losses related to the Inukshuk fixed wireless initiative estimated to be $35 million in 2007.
(5) Excludes PP&E expenditures related to Inukshuk of approximately $25 million in 2007.
(6) Rogers Business Solutions PP&E excludes integration costs estimated to be $25 million to $30 million in 2007.
(7) The increase in Media PP&E primarily reflects the relocation and construction of new studio facilities for Rogers SportsNet.
(8) Wireless subscriber net additions exclude any potential subscriber adjustments associated with the planned TDMA/analog network turndown.
(9) Residential cable RGUs are comprised of basic cable subscribers, digital cable households, residential high-speed Internet subscribers and residential cable and circuit-switched telephony subscribers. Includes
approximately 75,000 migrations from the circuit-switched telephony platform to the cable telephony platform.
2007 FINANCIAL AND OPERATING GUIDANCE
The following table outlines our financial and operational guidance
for the full year 2007. This information is forward-looking and should
be read in conjunction with the section above entitled “Caution
Regarding Forward-Looking Statements, Risks and Assumptions.”