Rogers 2006 Annual Report Download - page 93
Download and view the complete annual report
Please find page 93 of the 2006 Rogers annual report below. You can navigate through the pages in the report by either clicking on the pages listed below, or by using the keyword search tool below to find specific information within the annual report.-
 1
1 -
2
-
3
-
4
-
5
-
6
-
7
-
8
-
9
-
10
-
11
-
12
-
13
-
14
-
15
-
16
-
17
-
18
-
19
-
20
-
21
-
22
-
23
-
24
-
25
-
26
-
27
-
28
-
29
-
30
-
31
-
32
-
33
-
34
-
35
-
36
-
37
-
38
-
39
-
40
-
41
-
42
-
43
-
44
-
45
-
46
-
47
-
48
-
49
-
50
-
51
-
52
-
53
-
54
-
55
-
56
-
57
-
58
-
59
-
60
-
61
-
62
-
63
-
64
-
65
-
66
-
67
-
68
-
69
-
70
-
71
-
72
-
73
-
74
-
75
-
76
-
77
-
78
-
79
-
80
-
81
-
82
-
 83
83 -
 84
84 -
 85
85 -
 86
86 -
 87
87 -
 88
88 -
 89
89 -
 90
90 -
 91
91 -
 92
92 -
 93
93 -
 94
94 -
 95
95 -
 96
96 -
 97
97 -
 98
98 -
 99
99 -
 100
100 -
 101
101 -
 102
102 -
 103
103 -
104
-
105
-
106
-
107
-
108
-
109
-
110
-
111
-
112
-
113
-
114
-
115
-
116
-
117
-
118
-
119
-
120
 |
 |
89
RO GER S CO MMU NIC AT ION S IN C . 20 0 6 ANN UA L RE POR T
NOTES TO CONSOLIDATED FINANCIAL STATEMENTS
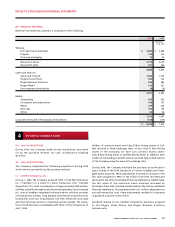
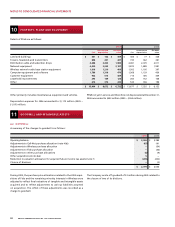
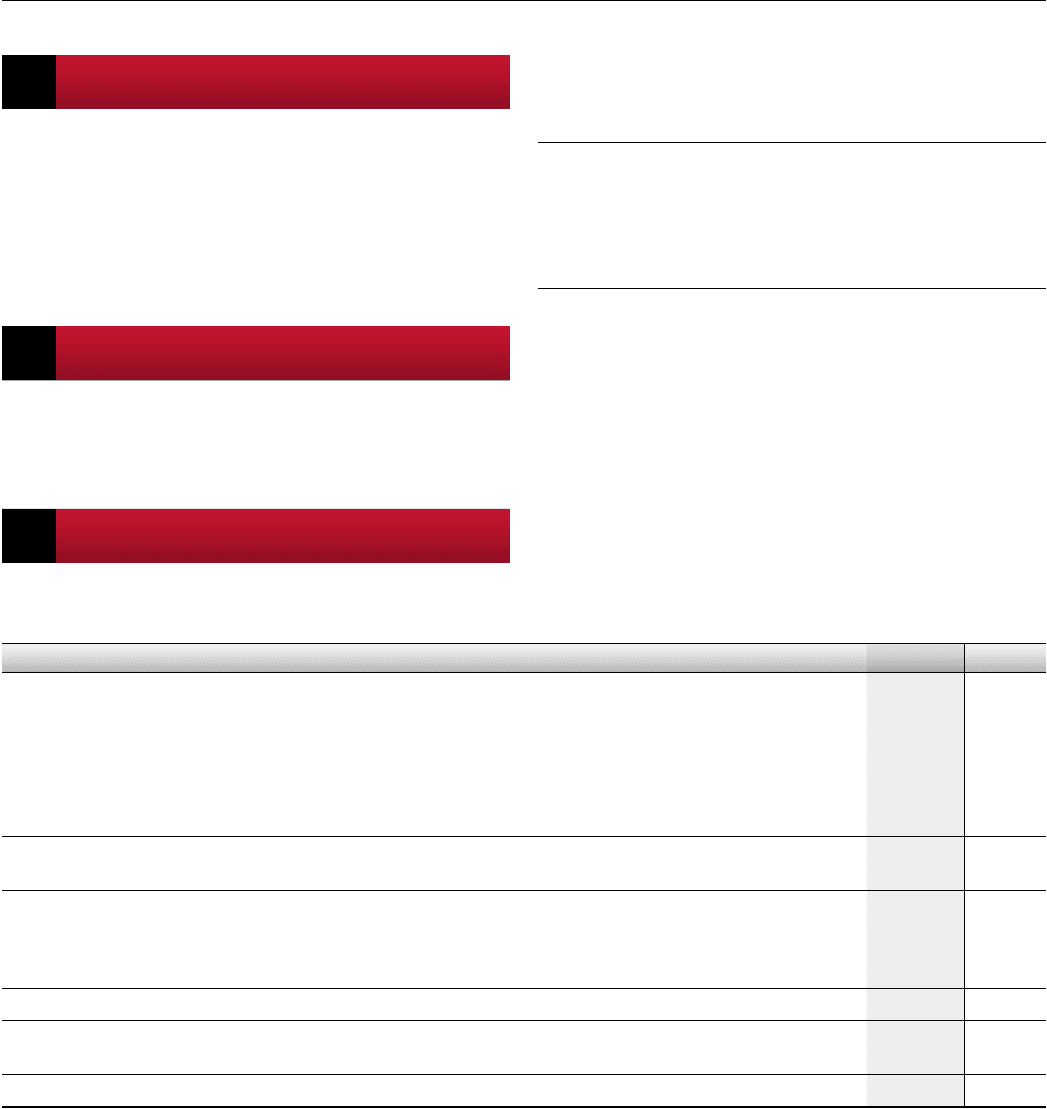
5 INV ESTMENT IN JOIN T VENTU RES
The Company has contributed certain assets to joint ventures
involved in the provision of wireless broadband Internet service
and in certain mobile commerce initiatives (notes 11(b) and 23). As
at December 31, 2006 and for the year then ended, proportionately
consolidating these joint ventures resulted in the following increases
(decreases) in the accounts of the Company:
6 STO RE CLOSURE EXPE NSES
During 2006, the Company closed 21 of its Rogers Retail stores in
Ontario and Quebec. The costs to exit these stores include lease ter-
mination and involuntary severance costs totalling $3 million, as well
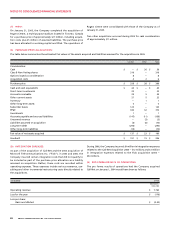
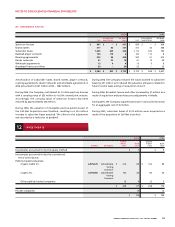
7 INC OME TAXES
The income tax effects of temporary differences that give rise to significant portions of future income tax assets and liabilities are as follows:
2006 2005
Future income tax assets:
Non-capital income tax loss carryforwards $ 981 $ 1,389
Capital loss carryforwards 21 5
Deductions relating to long-term debt and other transactions denominated in foreign currencies 41 87
Investments 52 59
PP&E and inventory 46 87
Other deductible differences 125 149
Total future income tax assets 1,266 1,776
Less valuation allowance 150 618
1,116 1,158
Future income tax liabilities:
Goodwill and intangible assets (407) (680)
Other taxable differences (23) (18)
Total future income tax liabilities (430) (698)
Net future income tax asset 686 460
Less current portion 387 113
$ 299 $ 347
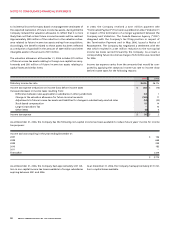
In assessing the realizability of future income tax assets, manage-
ment considers whether it is more likely than not that some portion
or all of the future income tax assets will be realized. The ultimate
realization of future income tax assets is dependent upon the gen-
eration of future taxable income during the years in which the
temporary differences are deductible. Management considers the
scheduled reversals of future income tax liabilities, the character of
the future income tax assets and available tax planning strategies
in making this assessment. To the extent that management believes
that the realization of future income tax assets does not meet the
more likely than not realization criterion, a valuation allowance is
recorded against the future income tax assets.
In making an assessment of whether future income tax assets are
more likely than not to be realized, management regularly prepares
information regarding the expected use of such assets by reference
Current assets $ 11
Long-term assets 42
Current liabilities 3
Revenue –
Expenses 20
Net income (20)
as a write-down of the related PP&E totalling $3 million for the year
ended December 31, 2006.