Rogers 2006 Annual Report Download - page 106
Download and view the complete annual report
Please find page 106 of the 2006 Rogers annual report below. You can navigate through the pages in the report by either clicking on the pages listed below, or by using the keyword search tool below to find specific information within the annual report.-
 1
1 -
2
-
3
-
4
-
5
-
6
-
7
-
8
-
9
-
10
-
11
-
12
-
13
-
14
-
15
-
16
-
17
-
18
-
19
-
20
-
21
-
22
-
23
-
24
-
25
-
26
-
27
-
28
-
29
-
30
-
31
-
32
-
33
-
34
-
35
-
36
-
37
-
38
-
39
-
40
-
41
-
42
-
43
-
44
-
45
-
46
-
47
-
48
-
49
-
50
-
51
-
52
-
53
-
54
-
55
-
56
-
57
-
58
-
59
-
60
-
61
-
62
-
63
-
64
-
65
-
66
-
67
-
68
-
69
-
70
-
71
-
72
-
73
-
74
-
75
-
76
-
77
-
78
-
79
-
80
-
81
-
82
-
83
-
84
-
85
-
86
-
87
-
88
-
89
-
90
-
91
-
92
-
93
-
94
-
95
-
 96
96 -
 97
97 -
 98
98 -
 99
99 -
 100
100 -
 101
101 -
 102
102 -
 103
103 -
 104
104 -
 105
105 -
 106
106 -
 107
107 -
 108
108 -
 109
109 -
 110
110 -
 111
111 -
 112
112 -
 113
113 -
 114
114 -
 115
115 -
 116
116 -
117
-
118
-
119
-
120
 |
 |

102 R OGE R S C OMM UNI C AT ION S I N C . 20 0 6 AN N UA L R E POR T
NOTES TO CONSOLIDATED FINANCIAL STATEMENTS
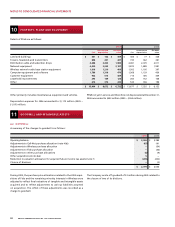
(C ) AC TUAL CONTRIBUTIONS TO THE PLANS ARE AS FOLLOWS:
Employer Employee Total
2006 $ 28 $ 15 $ 43
2005 21 14 35
Employee contributions for 2007 are assumed to be at levels similar
to 2006 on the assumption staffing levels in the Company will remain
the same on a year-over-year basis.
Expected contributions by the Company in 2007 are estimated to be
$25 million.
(D) EXPECTED C ASH FLOWS:
Expected benefit payments for funded and unfunded plans for fiscal year ending:
2007 $ 26
2008 25
2009 26
2010 26
2011 26
129
Next five years 133
$ 262
Blue Jays and Fido each have defined contribution plans with total pension expense of $2 million in 2006 (2005 – $5 million).
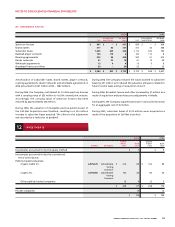
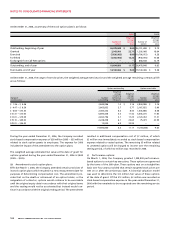
20 SHA REHO LDERS’ EQUI TY
During 2005 and 2006, the Company completed the following capital stock transactions:
Class A Voting shares Class B Non-Voting shares
Convertible Total
Number Number Preferred Contributed shareholders’
Amount of shares (000s) Amount of shares (000s) Securities surplus Deficit equity
Balances, December 31, 2004 $ 72 112,471 $ 356 437,958 $ 188 $ 2,289 $ (520) $ 2,385
Change in accounting policy related to
stock-based compensation (note 2(b)) – – – – – 4 (4) –
Net loss for the year – – – – – – (45) (45)
Stock options exercised – – 8 10,796 – 98 – 106
Stock-based compensation – – – – – 35 – 35
Shares issued in exchange for
Call-Net shares (note 4(b)) – – 14 16,929 – 310 – 324
Conversion of convertible preferred
securities (note 15(d)) – – 28 34,286 (188) 669 – 509
Dividends – – – – – – (37) (37)
Conversion of convertible debt (note 15(d)) – – 13 15,433 – 258 – 271
Conversion of Class A shares to Class B shares – (3) – 3 – – – –
Purchase price adjustment to unvested options – – – – – (20) – (20)
Balances, December 31, 2005 72 112,468 419 515,405 – 3,643 (606) 3,528
Net income for the year – – – – – – 622 622
Stock options exercised – – 6 7,827 – 61 – 67
Stock-based compensation – – – – – 32 – 32
Dividends – – – – – – (49) (49)
Balances, December 31, 2006 $ 72 112,468 $ 425 523,232 $ – $ 3,736 $ (33) $ 4,200