Rogers 2006 Annual Report Download - page 26
Download and view the complete annual report
Please find page 26 of the 2006 Rogers annual report below. You can navigate through the pages in the report by either clicking on the pages listed below, or by using the keyword search tool below to find specific information within the annual report.-
 1
1 -
2
-
3
-
4
-
5
-
6
-
7
-
8
-
9
-
10
-
11
-
12
-
13
-
14
-
15
-
 16
16 -
 17
17 -
 18
18 -
 19
19 -
 20
20 -
 21
21 -
 22
22 -
 23
23 -
 24
24 -
 25
25 -
 26
26 -
 27
27 -
 28
28 -
 29
29 -
 30
30 -
 31
31 -
 32
32 -
 33
33 -
 34
34 -
 35
35 -
 36
36 -
37
-
38
-
39
-
40
-
41
-
42
-
43
-
44
-
45
-
46
-
47
-
48
-
49
-
50
-
51
-
52
-
53
-
54
-
55
-
56
-
57
-
58
-
59
-
60
-
61
-
62
-
63
-
64
-
65
-
66
-
67
-
68
-
69
-
70
-
71
-
72
-
73
-
74
-
75
-
76
-
77
-
78
-
79
-
80
-
81
-
82
-
83
-
84
-
85
-
86
-
87
-
88
-
89
-
90
-
91
-
92
-
93
-
94
-
95
-
96
-
97
-
98
-
99
-
100
-
101
-
102
-
103
-
104
-
105
-
106
-
107
-
108
-
109
-
110
-
111
-
112
-
113
-
114
-
115
-
116
-
117
-
118
-
119
-
120
 |
 |
22 ROG ERS CO MMU N ICAT I ONS INC . 2006 ANN UA L RE P ORT
MANAGEMENT’S DISCUSSION AND ANALYSIS
OF FINANCIAL CONDITION AND RESULTS OF OPERATIONS
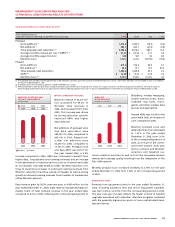
Depreciation and Amortization Expense
Depreciation and amortization expense was $95 million higher in
2006, compared to 2005. The increase primarily reflects the addi-
tional depreciation and amortization recognized on property, plant
and equipment (“PP&E”) expenditures and intangible assets arising
from acquisitions during 2005.
Operating Income
Operating income was $1,291 million in 2006, an increase of $636 mil-
lion, or 97.1%, from $655 million in 2005, reflecting growth in Wireless,
Cable and Telecom, and Media, partially offset by the increase in
depreciation and amortization expense as discussed previously.
Interest Expense on Long-Term Debt
The reduction in interest expense in 2006 compared to 2005 is primar-
ily due to the decrease in debt of more than $750 million, including
the impact of cross-currency interest rate exchange agreements.
This decrease in debt was largely the result of the repayment at
maturity in February 2006 of RCI’s $75 million 10.50% Senior Notes,
the repayment in June 2006 of the 10.5% Wireless Senior Secured
Notes in the aggregate principal amount outstanding of $160 mil-
lion, Wireless’ July 2006 repayment of a mortgage in the aggregate
principal amount outstanding of $22 million, and aggregate net
repayments under our various bank credit facilities of approximately
$452 million.
Loss on Repayment of Lon g -Term Debt
During 2006, we redeemed $26 million (U.S. $22 million) of RCI’s (via
RTHI, formerly Call-Net Enterprises Inc.) 10.625% Senior Secured
Notes due 2008, resulting in a loss on repayment of long-term debt
of $1 million. In 2005, we redeemed U.S. $114 million of Cable and
Telecom’s 11% Senior Subordinated Guaranteed Debentures due
2015 and $238 million of the 10.625% Senior Secured Notes due 2008.
These redemptions resulted in a loss on repayment of long-term
debt of $11 million in the year ended December 31, 2005, including
the write-off of the related deferred financing costs and deferred
transitional loss.
Foreign Exchange Gain
The foreign exchange gain of $2 million in 2006 arose primarily from
the strengthening of the Canadian dollar during 2006 from $1.1659
at December 31, 2005 to $1.1653 at December 31, 2006, favourably
affecting the translation of the unhedged portion of our U.S. dollar-
denominated debt. In the year ended December 31, 2005, a foreign
exchange gain of $35 million arose, given a 3.77 cent increase in the
Canadian dollar relative to the U.S. dollar.
Change in Fair Value of Derivative Instruments
The changes in fair value of the derivative instruments were primar-
ily the result of the changes in the Canadian dollar relative to that of
the U.S. dollar, as described above, and the resulting change in fair
value of our cross-currency interest rate exchange agreements not
accounted for as hedges.
Other Income
Other income of $10 million in 2006 and $2 million in 2005 was pri-
marily associated with investment income received from certain of
our investments, net of write-downs required to reflect other than
temporary declines in the values of certain investments.
Income Tax Exp ense
Current income tax expense has historically consisted primarily of
the Canadian Federal Large Corporations Tax (“LCT”). Due to the
elimination of this tax during 2006, no amount has been expensed
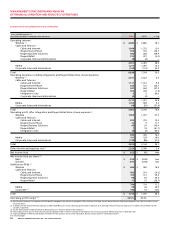
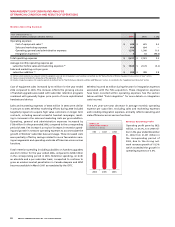
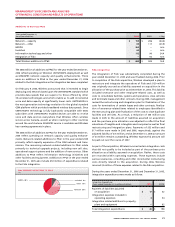
Reconciliation of Operating Profit to Net Income (Loss)
Years ended December 31,
(In millions of dollars) 2006 2005 % Chg
Operating profit (1) $ 2,875 $ 2,144 34.1
Depreciation and amortization (1,584) (1,489) 6.4
Operating income 1,291 655 97.1
Interest expense on long-term debt (620) (699) (11.3)
Loss on repayment of long-term debt (1) (11) (90.9)
Foreign exchange gain 2 35 (94.3)
Change in the fair value of derivative instruments (4) (25) (84.0)
Other income 10 2 n/m
Income tax reduction (expense)
Current 5 (11)
Future (61) 9 n/m
Net income (loss) $ 622 $ (45) n/m
(1) As defined. See the “Key Performance Indicators and Non-GAAP Measures” section.
The items listed below represent the consolidated income and
expense amounts that are required to reconcile operating profit to
net income (loss) as defined under Canadian GAAP.