Rogers 2006 Annual Report Download - page 43
Download and view the complete annual report
Please find page 43 of the 2006 Rogers annual report below. You can navigate through the pages in the report by either clicking on the pages listed below, or by using the keyword search tool below to find specific information within the annual report.-
 1
1 -
2
-
3
-
4
-
5
-
6
-
7
-
8
-
9
-
10
-
11
-
12
-
13
-
14
-
15
-
16
-
17
-
18
-
19
-
20
-
21
-
22
-
23
-
24
-
25
-
26
-
27
-
28
-
29
-
30
-
31
-
32
-
 33
33 -
 34
34 -
 35
35 -
 36
36 -
 37
37 -
 38
38 -
 39
39 -
 40
40 -
 41
41 -
 42
42 -
 43
43 -
 44
44 -
 45
45 -
 46
46 -
 47
47 -
 48
48 -
 49
49 -
 50
50 -
 51
51 -
 52
52 -
 53
53 -
54
-
55
-
56
-
57
-
58
-
59
-
60
-
61
-
62
-
63
-
64
-
65
-
66
-
67
-
68
-
69
-
70
-
71
-
72
-
73
-
74
-
75
-
76
-
77
-
78
-
79
-
80
-
81
-
82
-
83
-
84
-
85
-
86
-
87
-
88
-
89
-
90
-
91
-
92
-
93
-
94
-
95
-
96
-
97
-
98
-
99
-
100
-
101
-
102
-
103
-
104
-
105
-
106
-
107
-
108
-
109
-
110
-
111
-
112
-
113
-
114
-
115
-
116
-
117
-
118
-
119
-
120
 |
 |
39
RO GER S CO MMU NIC AT ION S IN C . 20 0 6 ANN UA L RE POR T
MANAGEMENT’S DISCUSSION AND ANALYSIS
OF FINANCIAL CONDITION AND RESULTS OF OPERATIONS
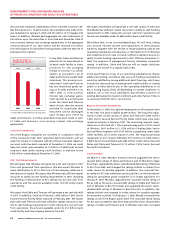
lines from circuit-switched lines
to cable telephony lines within
Cable and Telecom’s cable ter-
ritory. Despite the decline in
circuit-switched lines in the
year, revenue increased by
$11 million on a pro forma basis,
over 2005 due to a higher aver-
age number of circuit-switched
lines during the year compared
to 2005. The net growth in the
Rogers Home Phone subscriber
base contributed to incremen-
tal local service revenues of
approximately $73 million, on a
pro forma basis, during 2006.
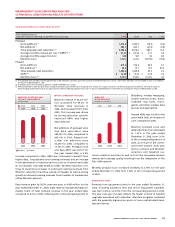
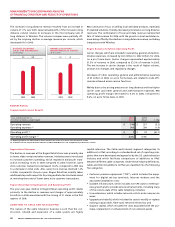
Rogers Home Phone Operating Expenses and Operating Profit
The significant growth and expansion of both sales and marketing
and operations associated with the launch of the cable telephony
service and overall increase in subscribers drove the increases in oper-
ating expenses of $82 million, on a pro forma basis, during 2006.
The year-over-year decreases in the Rogers Home Phone operating
profit and operating profit margins primarily reflect the additional
costs associated with the scaling and rapid growth of Cable and
Telecom’s cable telephony service including investment in the aware-
ness of the product, increased capacity to install and significantly
higher customer acquisition costs.
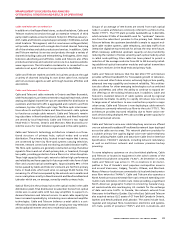
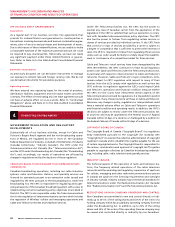
20062005
366 48
350391
Switched Residential Telephon
y
Subscribers
Cable Telephony Residential Subscribers
ROGERS HOME PHONE
SUBSCRIBERS
(In thousands)
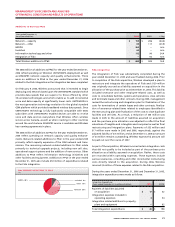
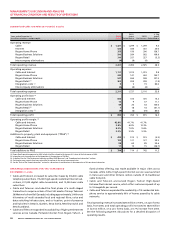
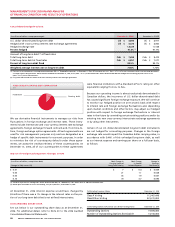
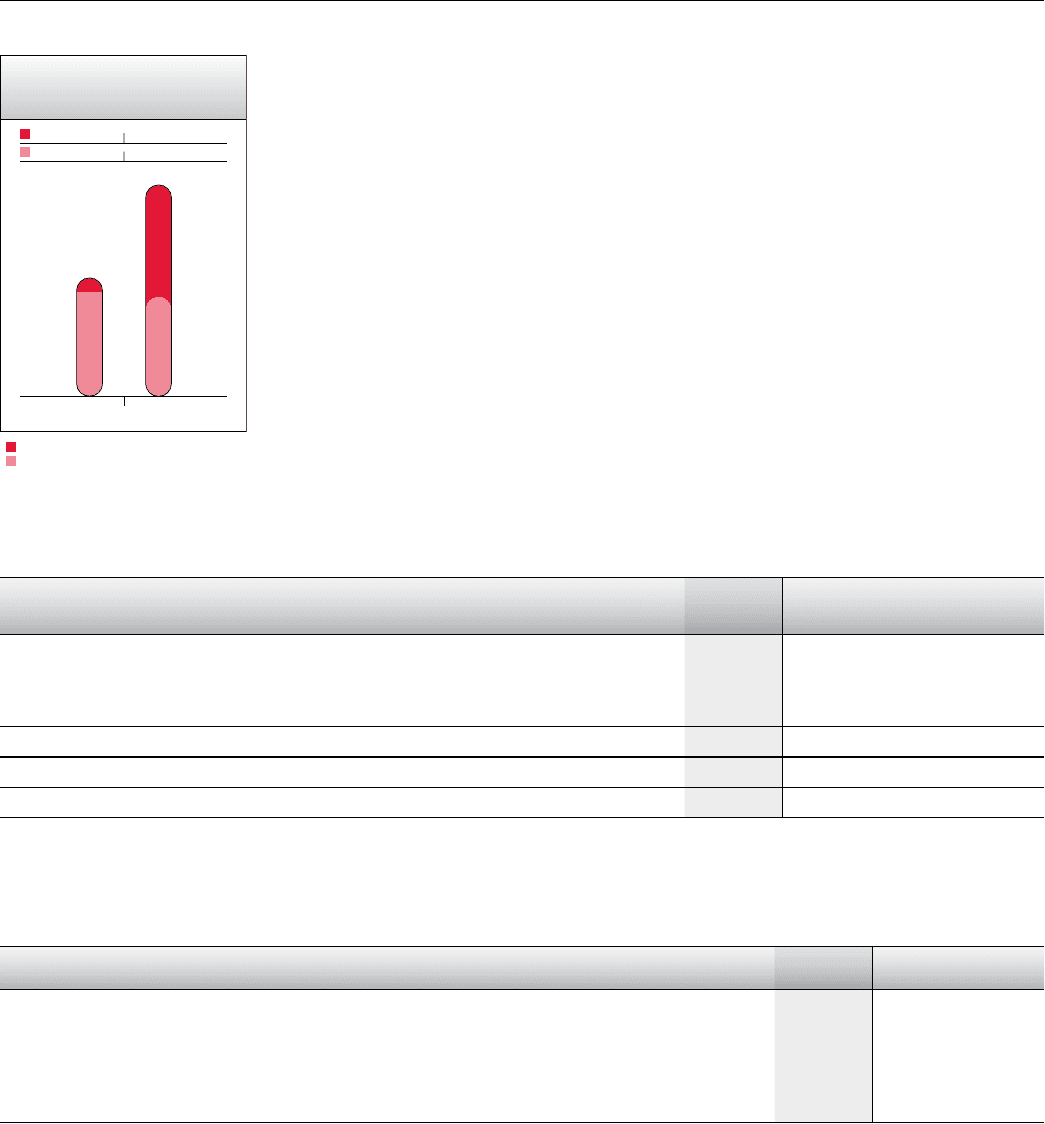
ROGERS BUSINESS SOLUTIONS
Summarized Financial Results
2005
Years ended December 31, 2006 Actual 2005 % Chg
(In millions of dollars, except margin) Actual Reclassified (2) Pro Forma (3) Pro Forma (3)
Operating revenue $ 596 $ 284 $ 562 6.0
Operating expenses
Sales and marketing expenses 70 38 71 (1.4)
Operating, general and administrative expenses 477 226 437 9.2
Total operating expenses 547 264 508 7.7
Operating profit (1) $ 49 $ 20 $ 54 (9.3)
Operating profit margin (1) 8.2% 7.0% 9.6%
(1) As defined. See the “Key Performance Indicators and Non-GAAP Measures” and “Supplementary Information” sections.
(2) Certain prior year amounts have been reclassified to conform with the current year presentation.
(3) See “Basis of Pro Forma Information” section for discussion of considerations in the preparation of this pro forma information.
Summarized Subscriber Results
Years ended December 31, 2006 2005 Chg
(Subscriber statistics in thousands) Actual Pro Forma (3) Pro Forma (3)
Local line equivalents (1)
Net additions 33.4 17.5 15.9
Total local line equivalents 205.0 171.6 33.4
Broadband data circuits (2)
Net additions 9.5 6.2 3.3
Total broadband data circuits 31.0 21.5 9.5
(1) Local line equivalents include individual voice lines plus Primary Rate Interfaces (“PRIs”) at a factor of 23 voice lines each and includes both wholesale and retail customers.
(2) Broadband data circuits are those customer locations accessed by data networking technologies including DOCSIS, DSL, E10/100/1000, OC 3/12 and DS 1/3.
(3) See “Basis of Pro Forma Information” section for discussion of considerations in the preparation of this pro forma information.
We believe that the pro forma information for 2005 presented in
this section presents a meaningful comparative analysis given that
Call-Net’s results are consolidated effective as of the July 1, 2005
acquisition date. The following discussion on the Rogers Business
Solutions results includes pro forma comparisons for 2005.
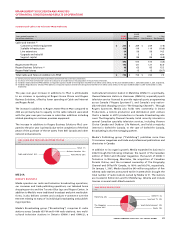
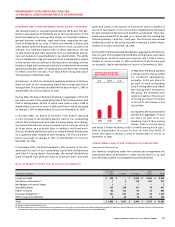
Rogers Business Solutions Revenue
The increase in Rogers Business Solutions (“RBS”) revenue reflects
growth in each of data, local and long distance components of
revenue. During 2006, data revenues grew by $12 million, local ser-
vices grew by $10 million, and long distance grew by $12 million, on
a pro forma basis, compared to 2005.
RBS ended the year with 205,000 local line equivalents and 31,000
broadband data circuits in service at December 31, 2006, represent-
ing year-over-year growth rates of 19.5% and 44.2%, on a pro forma
basis, respectively.