Rogers 2006 Annual Report Download - page 23
Download and view the complete annual report
Please find page 23 of the 2006 Rogers annual report below. You can navigate through the pages in the report by either clicking on the pages listed below, or by using the keyword search tool below to find specific information within the annual report.
19
RO GER S CO MMU NIC AT ION S IN C . 20 0 6 ANN UA L RE POR T
MANAGEMENT’S DISCUSSION AND ANALYSIS
OF FINANCIAL CONDITION AND RESULTS OF OPERATIONS
OUR STR ATEGY
Our business objective is to maximize subscribers, revenue, operating
profit and return on invested capital by enhancing our position
as one of Canada’s leading national diversified communications
and media companies. Our strategy is to be the preferred provider
of communications, entertainment and information services to
Canadians. We seek to take advantage of opportunities to leverage
our networks, infrastructure, sales channels, brand and marketing
resources across the Rogers group of companies to create value for
our customers and shareholders.
We help to identify and facilitate opportunities for Wireless, Cable
and Telecom, and Media to create bundled product and service
offerings, as well as for the cross-marketing and cross-promotion of
products and services to increase sales and enhance subscriber loy-
alty. We also work to identify and implement areas of opportunity
for our businesses that will enhance operating efficiencies by sharing
infrastructure, corporate services and sales distribution channels.
ACQUISITIONS
Acquisition of Call-Net Enterprises Inc .
On July 1, 2005, we acquired 100% of Call-Net Enterprises Inc. (“Call-
Net”), a Canadian integrated telecommunications solutions provider
of local, long distance and data services to more than 600,000 homes
and businesses across Canada, in a share-for-share transaction
announced May 11, 2005. The acquisition brought us an extensive
national fibre network with approximately 160 co-locations in major
urban areas across Canada and network facilities in the U.S. and
United Kingdom.
As consideration for the acquisition, Call-Net shareholders received
two Class B Non-Voting shares for each 4.25 shares of Call-Net.
Including estimated transaction costs of $4 million, the purchase
price of the acquisition was $328 million. This transaction has been
accounted for using the purchase method and we began to consoli-
date Call-Net’s results of operations with our own effective July 1,
2005. Subsequent to the acquisition, we changed the name of
Call-Net to Rogers Telecom Holdings Inc.
Refer to “Critical Accounting Estimates – Purchase Price Allocations”
and Note 4 to the 2006 Audited Consolidated Financial Statements
for more details regarding this transaction and updates to the
purchase price allocation in 2006.
CONSOLIDATED FINANCIAL AND OPERATING RESULTS
See the sections in this MD&A entitled “Critical Accounting Policies”,
“Critical Accounting Estimates” and “New Accounting Standards”
and also the Notes to the 2006 Audited Consolidated Financial
Statements for a discussion of critical and new accounting policies
and estimates as they relate to the discussion of our operating and
financial results below.
We measure the success of our strategies using a number of key
performance indicators as outlined in the section “Key Performance
Indicators and Non-GAAP Measures”. These key performance indi-
cators are not measurements in accordance with Canadian or
U.S. GAAP and should not be considered as alternatives to net income
or any other measure of performance under Canadian or U.S. GAAP.
Operating Highlights and Significant Developments in 2006
• In December 2006, we announced and implemented a two-for-
one split of our Class A Voting and Class B Non-Voting shares,
with the additional shares distributed to shareholders beginning
January 5, 2007.
• We announced an increase in the annual dividend from $0.075
to $0.16 per Class A Voting and Class B Non-Voting share (on a
post-split basis), and modified our dividend distribution policy to
now make dividend distributions on a quarterly basis instead of
semi-annually.
• We entered into a multi-year agreement with Maple Leaf Sports
and Entertainment (“MLSE”) which had Rogers become a lead spon-
sor and the preferred supplier of all communications services to the
Toronto Maple Leafs, Toronto Raptors and Air Canada Centre.
• We concluded the final phase of a multi-staged transaction to
acquire certain of the competitive local exchange carrier (“CLEC”)
assets of Group Telecom/360 Networks (“GT”) from Bell Canada,
including approximately 3,400 route kilometres of multi-stranded
local and regional fibre; voice and data switching infrastructure;
and co-location, point-of-presence and hub sites in Ontario, Quebec,
Nova Scotia, New Brunswick and Newfoundland and Labrador.
• We successfully launched our High-Speed Downlink Packet Access
(“HSDPA”) network in the Golden Horseshoe markets of Ontario.
This next generation broadband wireless technology, which
Wireless continues to deploy across other major markets, is the
fastest mobile wireless data service available in Canada.
Year Ended December 31, 20 06 Compared to Year Ended
December 31, 2005
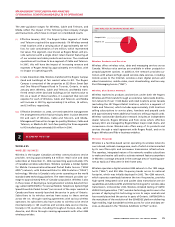
For the year ended December 31, 2006, Wireless, Cable and Telecom,
and Media represented 51.8%, 36.2%, and 13.7% of our consolidated
revenue, respectively, offset by corporate items and eliminations of
1.7%. Wireless, Cable and Telecom also represented 68.5%, 31.0%,
and 5.3% of our consolidated operating profit, respectively, offset
by corporate items and eliminations of 4.8%. For more detailed dis-
cussions of Wireless, Cable and Telecom, and Media, refer to the
respective segment discussions below. Our financial results include
the operations of Call-Net from the July 1, 2005 date of acquisition.
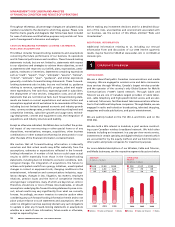
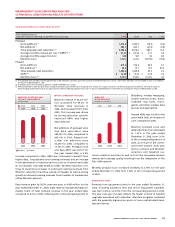
200620052004
$1,712$1,355$1,055
ADDITIONS TO
CONSOLIDATED PP&E
(In millions of dollars)
200620052004
$14,105$13,834$13,273
CONSOLIDATED
TOTAL ASSETS
(In millions of dollars)


