Rogers 2006 Annual Report Download - page 41
Download and view the complete annual report
Please find page 41 of the 2006 Rogers annual report below. You can navigate through the pages in the report by either clicking on the pages listed below, or by using the keyword search tool below to find specific information within the annual report.-
 1
1 -
2
-
3
-
4
-
5
-
6
-
7
-
8
-
9
-
10
-
11
-
12
-
13
-
14
-
15
-
16
-
17
-
18
-
19
-
20
-
21
-
22
-
23
-
24
-
25
-
26
-
27
-
28
-
29
-
30
-
 31
31 -
 32
32 -
 33
33 -
 34
34 -
 35
35 -
 36
36 -
 37
37 -
 38
38 -
 39
39 -
 40
40 -
 41
41 -
 42
42 -
 43
43 -
 44
44 -
 45
45 -
 46
46 -
 47
47 -
 48
48 -
 49
49 -
 50
50 -
 51
51 -
52
-
53
-
54
-
55
-
56
-
57
-
58
-
59
-
60
-
61
-
62
-
63
-
64
-
65
-
66
-
67
-
68
-
69
-
70
-
71
-
72
-
73
-
74
-
75
-
76
-
77
-
78
-
79
-
80
-
81
-
82
-
83
-
84
-
85
-
86
-
87
-
88
-
89
-
90
-
91
-
92
-
93
-
94
-
95
-
96
-
97
-
98
-
99
-
100
-
101
-
102
-
103
-
104
-
105
-
106
-
107
-
108
-
109
-
110
-
111
-
112
-
113
-
114
-
115
-
116
-
117
-
118
-
119
-
120
 |
 |
37
RO GER S CO MMU NIC AT ION S IN C . 20 0 6 ANN UA L RE POR T
MANAGEMENT’S DISCUSSION AND ANALYSIS
OF FINANCIAL CONDITION AND RESULTS OF OPERATIONS
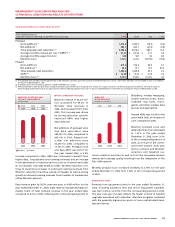
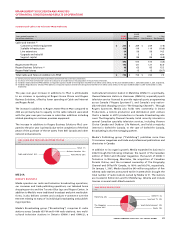
Cable Revenue
The increase in Cable revenue in 2006 reflects a combination of price
increases, growth in basic subscribers and growing penetration of
Cable and Telecom’s digital products. The price increases on service
offerings effective March 2006 contributed to the year-over-year
cable revenue growth by approximately $53 million. The remaining
increase in revenue of $69 million is related mainly to the impact of
the growth in basic and digital subscribers.
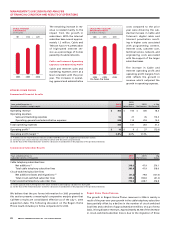
The basic subscriber base of nearly 2.3 million has increased by
approximately 13,000 in 2006 and represents approximately 65.4% of
homes passed. The digital subscriber base growth of 24.2% during
2006 to over 1.1 million households represents a 49.8% penetration
of basic cable customers and was driven by increases in program-
ming and the demand for Cable and Telecom’s high-definition and
personal video recorder digital equipment.
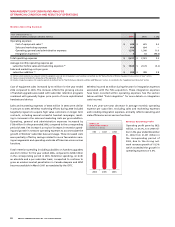
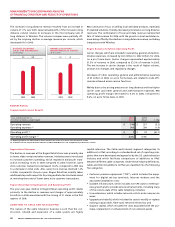
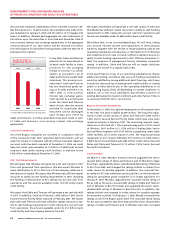
Internet (Residential) Revenue
The increase in Internet rev-
enues from the corresponding
period in 2005 primarily
reflects the 13.6% year-over-
year increase in the number of
Internet subscribers combined
with certain price increases for
Cable and Telecom’s Internet
offerings. The price increases on
Cable and Telecom’s Internet
offerings, effective March 2006,
contributed to the year-over-
year Internet revenue growth
by approximately $29 million.
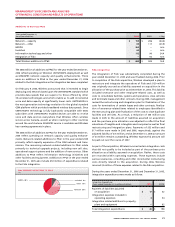
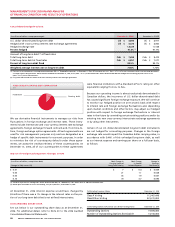
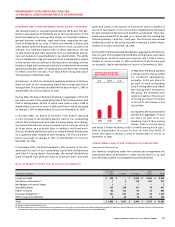
CABLE AND INTERNET
Summarized Financial Results
2005 % Chg
Years ended December 31, 2006 Actual Actual
(In millions of dollars, except margin) Actual Reclassified (2) Reclassified (2)
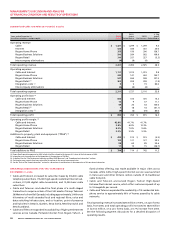
Operating revenue
Cable $ 1,421 $ 1,299 9.4
Internet 523 436 20.0
Total 1,944 1,735 12.0
Operating expenses
Sales and marketing expenses 123 123 –
Operating, general and administrative expenses 988 889 11.1
Total 1,111 1,012 9.8
Operating profit (1) $ 833 $ 723 15.2
Operating profit margin (1) 42.8% 41.7%
(1) As defined. See the “Key Performance Indicators and Non-GAAP Measures” and “Supplementary Information” sections.
(2) Certain prior year amounts have been reclassified to conform with the current year presentation.
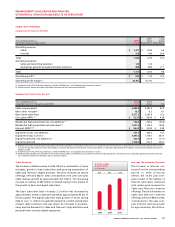
Summarized Subscriber Results
Years ended December 31, 2006 2005
(Subscriber statistics in thousands, except ARPU) Actual Actual Chg
Cable homes passed 3,480.8 3,387.5 93.3
Basic cable, net gain (1) 13.3 9.2 4.1
Basic cable subscribers 2,277.1 2,263.8 13.3
Core cable ARPU (2) $ 52.37 $ 48.09 $ 4.28
Residential high-speed Internet, net additions (1) 154.8 205.0 (50.2)
Residential high-speed Internet subscribers (3) 1,291.0 1,136.2 154.8
Internet ARPU (2)(3) $ 36.02 $ 35.04 $ 0.98
Digital terminals, net additions 357.7 344.0 13.7
Digital terminals in service 1,497.4 1,139.7 357.7
Digital households, net additions (1) 220.7 237.8 (17.1)
Digital households 1,134.0 913.3 220.7
(1) Effective August 2005, voluntarily deactivating Cable and Internet subscribers are required to continue service for 30 days from the date termination is requested. This continued service period, which is consis-
tent with the subscriber agreement terms and conditions, resulted in approximately 9,500 greater net basic cable additions, 5,200 greater high-speed Internet additions and 3,800 greater digital household net
additions in 2005.
(2) As defined. See the “Key Performance Indicators and Non-GAAP Measures” and “Supplementary Information” sections.
(3) Residential high-speed Internet subscribers do not include residential ADSL and fixed wireless subscribers. The prior year high-speed Internet subscriber base was reduced by approximately 8,900 to reclassify
non-residential customers into the Rogers Business Solutions segment.
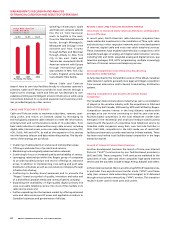
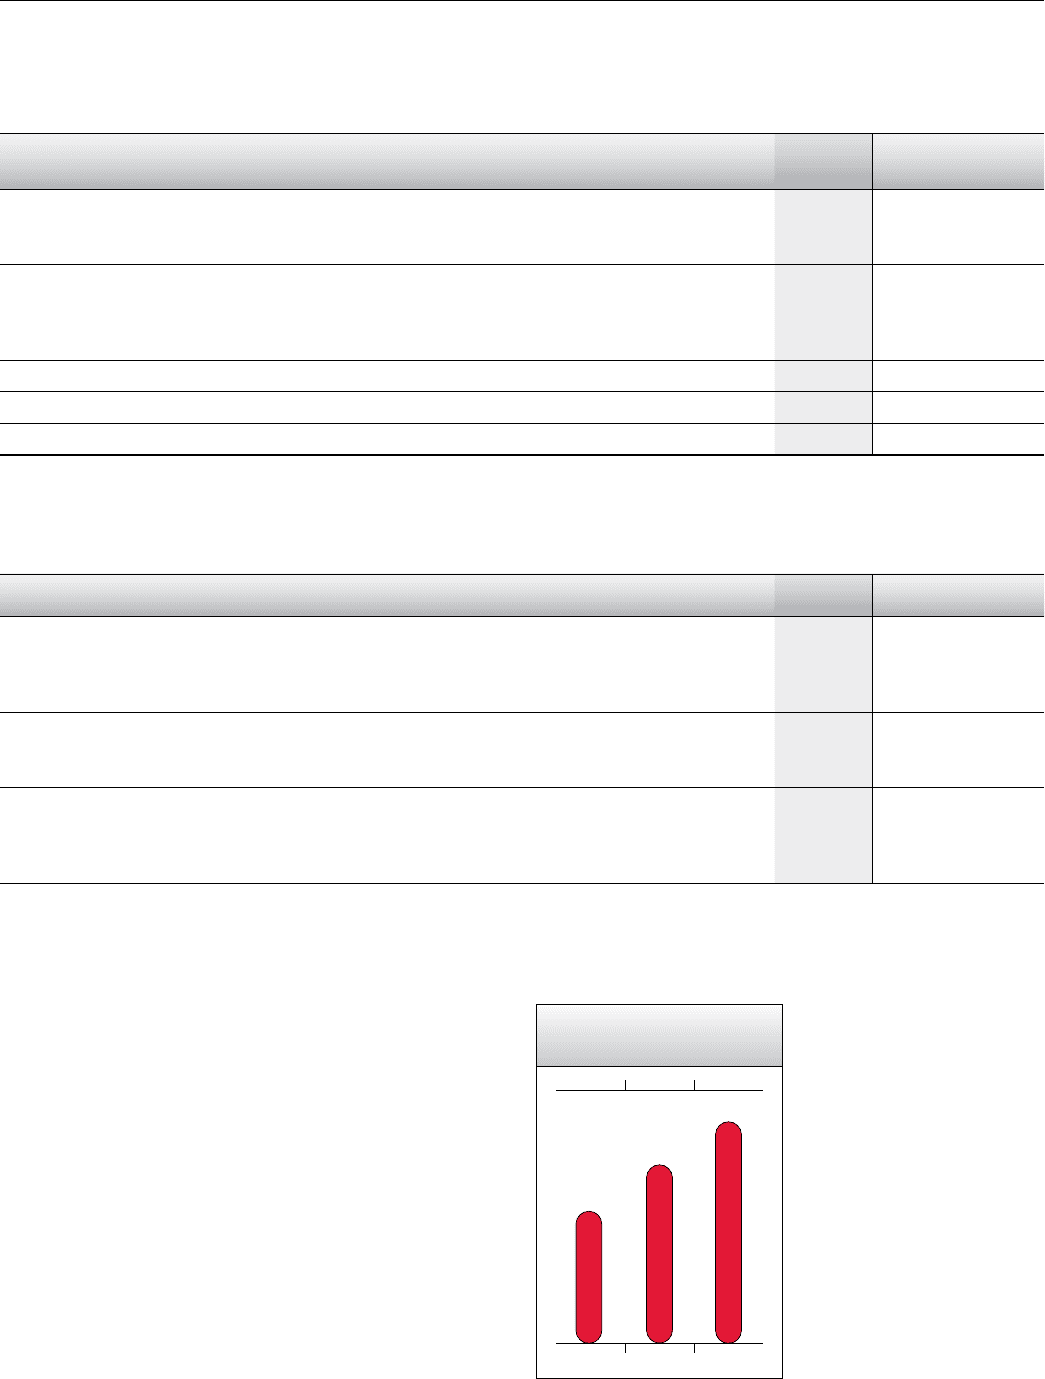
200620052004
1,134913675
DIGITAL CABLE
HOUSEHOLDS
(In thousands)