Rogers 2006 Annual Report Download - page 74
Download and view the complete annual report
Please find page 74 of the 2006 Rogers annual report below. You can navigate through the pages in the report by either clicking on the pages listed below, or by using the keyword search tool below to find specific information within the annual report.-
 1
1 -
2
-
3
-
4
-
5
-
6
-
7
-
8
-
9
-
10
-
11
-
12
-
13
-
14
-
15
-
16
-
17
-
18
-
19
-
20
-
21
-
22
-
23
-
24
-
25
-
26
-
27
-
28
-
29
-
30
-
31
-
32
-
33
-
34
-
35
-
36
-
37
-
38
-
39
-
40
-
41
-
42
-
43
-
44
-
45
-
46
-
47
-
48
-
49
-
50
-
51
-
52
-
53
-
54
-
55
-
56
-
57
-
58
-
59
-
60
-
61
-
62
-
63
-
 64
64 -
 65
65 -
 66
66 -
 67
67 -
 68
68 -
 69
69 -
 70
70 -
 71
71 -
 72
72 -
 73
73 -
 74
74 -
 75
75 -
 76
76 -
 77
77 -
 78
78 -
 79
79 -
 80
80 -
 81
81 -
 82
82 -
 83
83 -
 84
84 -
85
-
86
-
87
-
88
-
89
-
90
-
91
-
92
-
93
-
94
-
95
-
96
-
97
-
98
-
99
-
100
-
101
-
102
-
103
-
104
-
105
-
106
-
107
-
108
-
109
-
110
-
111
-
112
-
113
-
114
-
115
-
116
-
117
-
118
-
119
-
120
 |
 |

70 R OGE RS C OMM UNI C ATIO N S I N C . 20 0 6 AN N UA L R EPOR T
MANAGEMENT’S DISCUSSION AND ANALYSIS
OF FINANCIAL CONDITION AND RESULTS OF OPERATIONS
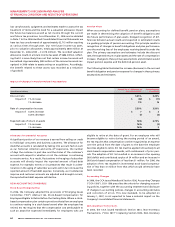
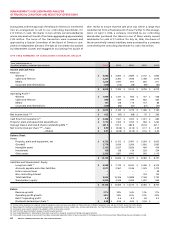
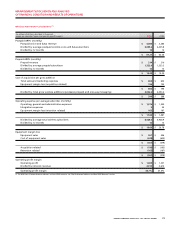
2006 Q uarterly Consolidated Financial Summar y
2006
(In millions of dollars, except per share amounts) Q1 Q2 Q3 Q4
Operating revenue
Wireless (1) $ 1,005 $ 1,094 $ 1,224 $ 1,257
Cable and Telecom 772 787 800 842
Media 240 334 319 317
Corporate and eliminations (33) (36) (38) (46)
1,984 2,179 2,305 2,370
Operating profit (2)
Wireless 405 486 561 517
Cable and Telecom 212 233 214 231
Media 13 52 39 47
Corporate and eliminations (36) (27) (29) (43)
594 744 785 752
Depreciation and amortization 386 395 408 395
Operating income 208 349 377 357
Interest on long-term debt (161) (155) (153) (151)
Other income (expense) 1 17 6 (17)
Income tax reduction (expense) (35) 68 (76) (13)
Net income for the period $ 13 $ 279 $ 154 $ 176
Net income per share (3) – basic $ 0.02 $ 0.44 $ 0.25 $ 0.28
– diluted $ 0.02 $ 0.44 $ 0.24 $ 0.27
Operating profit margin % (2) 30% 34% 34% 32%
Additions to PP&E (2) $ 340 $ 403 $ 415 $ 554
(1) Certain current and prior year amounts related to equipment sales have been reclassified. See “Reclassification of Wireless Equipment Sales and Cost of Sales” section for further details.
(2) As defined in “Key Performance Indicators Non-GAAP Measures” section.
(3) Prior period per share amounts have been retroactively adjusted to reflect a two-for-one split of the Company’s Class A Voting and Class B Non-Voting shares on December 29, 2006.