Rogers 2006 Annual Report Download - page 42
Download and view the complete annual report
Please find page 42 of the 2006 Rogers annual report below. You can navigate through the pages in the report by either clicking on the pages listed below, or by using the keyword search tool below to find specific information within the annual report.-
 1
1 -
2
-
3
-
4
-
5
-
6
-
7
-
8
-
9
-
10
-
11
-
12
-
13
-
14
-
15
-
16
-
17
-
18
-
19
-
20
-
21
-
22
-
23
-
24
-
25
-
26
-
27
-
28
-
29
-
30
-
31
-
 32
32 -
 33
33 -
 34
34 -
 35
35 -
 36
36 -
 37
37 -
 38
38 -
 39
39 -
 40
40 -
 41
41 -
 42
42 -
 43
43 -
 44
44 -
 45
45 -
 46
46 -
 47
47 -
 48
48 -
 49
49 -
 50
50 -
 51
51 -
 52
52 -
53
-
54
-
55
-
56
-
57
-
58
-
59
-
60
-
61
-
62
-
63
-
64
-
65
-
66
-
67
-
68
-
69
-
70
-
71
-
72
-
73
-
74
-
75
-
76
-
77
-
78
-
79
-
80
-
81
-
82
-
83
-
84
-
85
-
86
-
87
-
88
-
89
-
90
-
91
-
92
-
93
-
94
-
95
-
96
-
97
-
98
-
99
-
100
-
101
-
102
-
103
-
104
-
105
-
106
-
107
-
108
-
109
-
110
-
111
-
112
-
113
-
114
-
115
-
116
-
117
-
118
-
119
-
120
 |
 |

38 ROG E RS COM MUN I C ATIO NS I NC. 2 0 0 6 A N NUAL R EPO R T
MANAGEMENT’S DISCUSSION AND ANALYSIS
OF FINANCIAL CONDITION AND RESULTS OF OPERATIONS
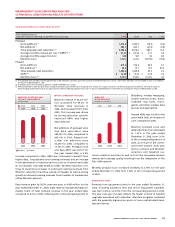
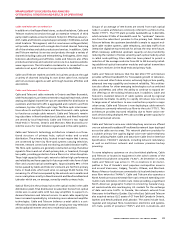
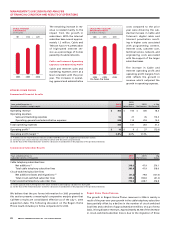
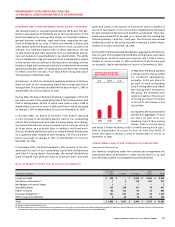
The remaining increase in rev-
enue is related mainly to the
impact from the growth in
subscribers. With the Internet
subscriber base now at approxi-
mately 1.3 million, Cable and
Telecom has 37.1% penetration
of high-speed Internet ser-
vice as a percentage of homes
passed by its cable networks.
Cable a nd Int e rnet O p erating
Expenses and Operating Profit
Cable and Internet sales and
marketing expenses were at a
level consistent with the prior
year. The increases in operat-
ing, general and administrative
costs compared to the prior
year were driven by the sub-
stantial increase in Cable and
Telecom’s digital cable and
Internet penetration result-
ing in higher costs associated
with programming content,
Internet costs, customer care,
technical service, network, and
engineering costs associated
with the support of the larger
subscriber bases.
The increase in Cable and
Internet operating profit and
operating profit margins from
2005 reflects the growth in
revenue which outpaced the
growth in operating expenses.
200620052004
1,2911,136931
CABLE INTERNET
SUBSCRIBERS
(In thousands)
20062005
Pro forma
2004
Pro forma
$890$815$808
CABLE AND TELECOM
OPERATING PROFIT
(In millions of dollars)
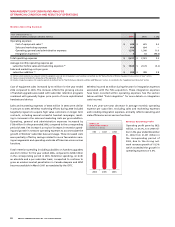
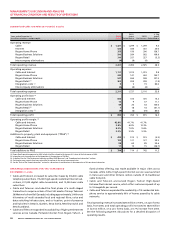
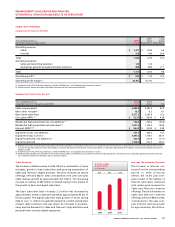
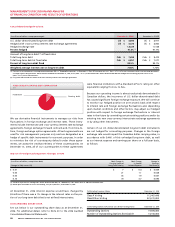
ROGERS HOME PHONE
Summarized Financial Results
2005
Years ended December 31, 2006 Actual 2005 % Chg
(In millions of dollars, except margin) Actual Reclassified (2) Pro Forma (3) Pro Forma (3)
Operating revenue $ 355 $ 150 $ 300 18.3
Operating expenses
Sales and marketing expenses 96 27 45 113.3
Operating, general and administrative expenses 249 114 218 14.2
Total operating expenses 345 141 263 31.2
Operating profit (1) $ 10 $ 9 $ 37 (73.0)
Operating profit margin (1) 2.8% 6.0% 12.3%
(1) As defined. See the “Key Performance Indicators and Non-GAAP Measures” and “Supplementary Information” sections.
(2) Certain prior year amounts have been reclassified to conform with the current year presentation.
(3) See the “Basis of Pro Forma Information” section for a discussion of considerations in the preparation of this pro forma information.
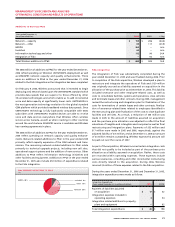
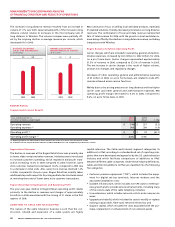
Summarized Subscriber Results
Years ended December 31, 2006 2005 Chg
(Subscriber statistics in thousands) Actual Pro Forma (2) Actual
Cable telephony subscriber lines
Net additions (1) 318.0 47.9 270.1
Total cable telephony subscriber lines 365.9 47.9 318.0
Circuit-switched subscriber lines
Net additions (losses and migrations) (1) (41.2) 79.8 (121.0)
Total circuit-switched subscriber lines 349.6 390.8 (41.2)
Total residential telephony subscriber lines 715.5 438.7 276.8
(1) Includes approximately 36,700 migrations from circuit-switched to cable telephony subscriber lines during 2006.
(2) See the “Basis of Pro Forma Information” section for a discussion of considerations in the preparation of this pro forma information.
We believe that the pro forma information for 2005 presented in
this section presents a meaningful comparative analysis given that
Call-Net’s results are consolidated effective as of the July 1, 2005
acquisition date. The following discussion on the Rogers Home
Phone results includes pro forma comparisons for 2005.
Rogers Home Phone Revenue
The growth in Rogers Home Phone revenues in 2006 is mainly a
result of the year-over-year growth in the cable telephony subscriber
base partially offset by a decline in the number of circuit-switched
local lines and a decline of approximately $18 million, on a pro forma
basis, in long distance revenues. Approximately 36,700 of the decrease
in circuit-switched subscriber lines is due to the migration of those