Rogers 2006 Annual Report Download - page 40
Download and view the complete annual report
Please find page 40 of the 2006 Rogers annual report below. You can navigate through the pages in the report by either clicking on the pages listed below, or by using the keyword search tool below to find specific information within the annual report.-
 1
1 -
2
-
3
-
4
-
5
-
6
-
7
-
8
-
9
-
10
-
11
-
12
-
13
-
14
-
15
-
16
-
17
-
18
-
19
-
20
-
21
-
22
-
23
-
24
-
25
-
26
-
27
-
28
-
29
-
 30
30 -
 31
31 -
 32
32 -
 33
33 -
 34
34 -
 35
35 -
 36
36 -
 37
37 -
 38
38 -
 39
39 -
 40
40 -
 41
41 -
 42
42 -
 43
43 -
 44
44 -
 45
45 -
 46
46 -
 47
47 -
 48
48 -
 49
49 -
 50
50 -
51
-
52
-
53
-
54
-
55
-
56
-
57
-
58
-
59
-
60
-
61
-
62
-
63
-
64
-
65
-
66
-
67
-
68
-
69
-
70
-
71
-
72
-
73
-
74
-
75
-
76
-
77
-
78
-
79
-
80
-
81
-
82
-
83
-
84
-
85
-
86
-
87
-
88
-
89
-
90
-
91
-
92
-
93
-
94
-
95
-
96
-
97
-
98
-
99
-
100
-
101
-
102
-
103
-
104
-
105
-
106
-
107
-
108
-
109
-
110
-
111
-
112
-
113
-
114
-
115
-
116
-
117
-
118
-
119
-
120
 |
 |

36 ROG ERS CO M MU N ICAT I ONS I N C . 20 0 6 AN N UA L R E POR T
MANAGEMENT’S DISCUSSION AND ANALYSIS
OF FINANCIAL CONDITION AND RESULTS OF OPERATIONS
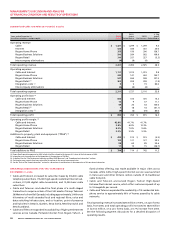
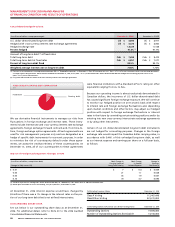
Summarized Cable and Telecom Financial Results
2005 % Chg
Years ended December 31, 2006 Actual 2005 Actual
(In millions of dollars, except margin) Actual Reclassified (4) Pro Forma (5) Reclassified (4)
Operating revenue
Cable $ 1,421 $ 1,299 $ 1,299 9.4
Internet 523 436 441 20.0
Rogers Home Phone 355 150 300 136.7
Rogers Business Solutions 596 284 562 109.9
Rogers Retail 310 327 327 (5.2)
Intercompany eliminations (4) (4) (4) –
Total operating revenue 3,201 2,492 2,925 28.5
Operating expenses
Cable and Internet 1,111 1,012 1,015 9.8
Rogers Home Phone 345 141 263 144.7
Rogers Business Solutions 547 264 508 107.2
Rogers Retail (1) 303 309 309 (1.9)
Integration costs (2) 9 5 19 80.0
Intercompany eliminations (4) (4) (4) –
Total operating expense 2,311 1,727 2,110 33.8
Operating profit (loss) (3)
Cable and Internet 833 723 725 15.2
Rogers Home Phone 10 9 37 11.1
Rogers Business Solutions 49 20 54 145.0
Rogers Retail (1) 7 18 18 (61.1)
Integration costs (2) (9) (5) (19) 80.0
Total operating profit $ 890 $ 765 $ 815 16.3
Operating profit margin: (3)
Cable and Internet 42.8% 41.7% 41.7%
Rogers Home Phone 2.8% 6.0% 12.3%
Rogers Business Solutions 8.2% 7.0% 9.6%
Rogers Retail 2.3% 5.5% 5.5%
Additions to property, plant and equipment (“PP&E”) (3)
Cable and Internet $ 492 $ 515 $ 515 (4.5)
Rogers Home Phone 193 121 127 59.5
Rogers Business Solutions 98 63 85 55.6
Rogers Retail 11 15 15 (26.7)
Total additions to PP&E $ 794 $ 714 $ 742 11.2
(1) Rogers Retail operating expenses for 2006 include $6 million related to the closure of 21 stores in the first quarter of 2006.
(2) Integration costs incurred relate to the integration of the operations of Call-Net.
(3) As defined. See the “Key Performance Indicators and Non-GAAP Measures” and “Supplementary Information” sections.
(4) Certain prior year amounts have been reclassified to conform to the current year presentation.
(5) See the “Basis of Pro Forma Information” section for a discussion of considerations in the preparation of this pro forma information.
fixed wireless offering, was made available in major cities across
Canada, while ADSL2 high-speed Internet service was launched
in Vancouver and other Ontario centres outside of its traditional
cable footprint.
• Cable and Telecom announced Rogers Yahoo! High-Speed
Extreme Plus Internet service, which offers customers speeds of up
to 18 megabits per second.
• Cable and Telecom expanded the availability of its residential tele-
phony service to approximately 90% of homes passed by its cable
networks.
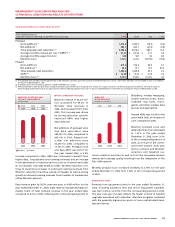
Total operating revenue increased $276 million or 9.4%, on a pro forma
basis, from 2005, and total operating profit increased to $826 million
or by $52 million, on a pro forma basis, a 6.7% increase from 2005.
See the following segment discussions for a detailed discussion of
operating results.
OPERATING HIGHLIGHTS FOR THE YEAR ENDED
DECEMBER 31, 20 06
• Cable and Telecom increased its subscriber bases by 318,000 cable
telephony subscribers, 155,000 high-speed residential Internet sub-
scribers, 221,000 digital cable households, and 13,000 basic cable
subscribers.
• Cable and Telecom concluded the final phase of a multi-staged
transaction to acquire certain of the CLEC assets of Group Telecom/
360Networks from Bell Canada, including approximately 3,400 route
kilometres of multi-stranded local and regional fibre; voice and
data switching infrastructure, and co-location, point-of-presence
and hub sites in Ontario, Quebec, Nova Scotia, New Brunswick and
Newfoundland.
• Cable and Telecom expanded its availability of high-speed Internet
services across Canada. Portable Internet from Rogers Yahoo!, a