Rogers 2006 Annual Report Download - page 72
Download and view the complete annual report
Please find page 72 of the 2006 Rogers annual report below. You can navigate through the pages in the report by either clicking on the pages listed below, or by using the keyword search tool below to find specific information within the annual report.-
 1
1 -
2
-
3
-
4
-
5
-
6
-
7
-
8
-
9
-
10
-
11
-
12
-
13
-
14
-
15
-
16
-
17
-
18
-
19
-
20
-
21
-
22
-
23
-
24
-
25
-
26
-
27
-
28
-
29
-
30
-
31
-
32
-
33
-
34
-
35
-
36
-
37
-
38
-
39
-
40
-
41
-
42
-
43
-
44
-
45
-
46
-
47
-
48
-
49
-
50
-
51
-
52
-
53
-
54
-
55
-
56
-
57
-
58
-
59
-
60
-
61
-
 62
62 -
 63
63 -
 64
64 -
 65
65 -
 66
66 -
 67
67 -
 68
68 -
 69
69 -
 70
70 -
 71
71 -
 72
72 -
 73
73 -
 74
74 -
 75
75 -
 76
76 -
 77
77 -
 78
78 -
 79
79 -
 80
80 -
 81
81 -
 82
82 -
83
-
84
-
85
-
86
-
87
-
88
-
89
-
90
-
91
-
92
-
93
-
94
-
95
-
96
-
97
-
98
-
99
-
100
-
101
-
102
-
103
-
104
-
105
-
106
-
107
-
108
-
109
-
110
-
111
-
112
-
113
-
114
-
115
-
116
-
117
-
118
-
119
-
120
 |
 |
68 ROG E RS COM MUN I C ATIO NS I NC. 2 0 0 6 A N NUAL R EPO R T
MANAGEMENT’S DISCUSSION AND ANALYSIS
OF FINANCIAL CONDITION AND RESULTS OF OPERATIONS
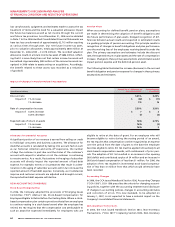
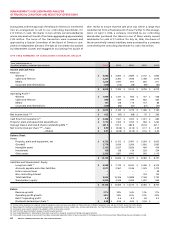
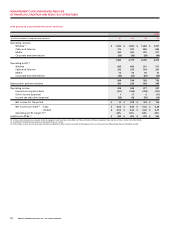
FIVE-YEAR SUMMARY OF CONSOLIDATED FINANC IAL RESULTS
Years ended December 31,
(In millions of dollars, except per share amounts) 2006 2005 2004 2003 2002
Income and Cash Flow:
Revenue
Wireless (1) $ 4,580 $ 3,860 $ 2,689 $ 2,152 $ 1,843
Cable and Telecom 3,201 2,492 1,946 1,788 1,615
Media 1,210 1,097 957 855 811
Corporate and eliminations (153) (115) (78) (59) (50)
$ 8,838 $ 7,334 $ 5,514 $ 4,736 $ 4,219
Operating Profit (2)
Wireless $ 1,969 $ 1,337 $ 950 $ 727 $ 528
Cable and Telecom 890 765 709 663 563
Media 151 128 115 107 88
Corporate and eliminations (135) (86) (41) (51) (37)
$ 2,875 $ 2,144 $ 1,733 $ 1,446 $ 1,142
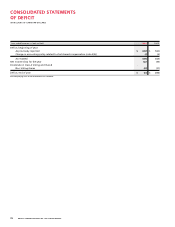
Net Income (loss) (3)(5) $ 622 $ (45) $ (68) $ 76 $ 260
Cash flow from operations (4) $ 2,386 $ 1,551 $ 1,305 $ 1,031 $ 683
Property, plant and equipment expenditures $ 1,712 $ 1,355 $ 1,055 $ 964 $ 1,262
Average Class A and Class B shares outstanding (Ms) (6) 641.9 577.3 480.8 451.8 427.1
Net income (loss) per share (3)(6) – basic $ 0.99 $ (0.08) $ (0.14) $ 0.17 $ 0.53
– diluted $ 0.97 $ (0.08) $ (0.14) $ 0.16 $ 0.42
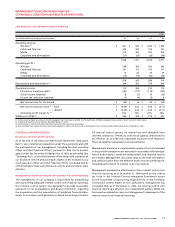
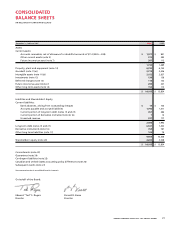
Balance Sheet:
Assets
Property, plant and equipment, net $ 6,732 $ 6,152 $ 5,487 $ 5,039 $ 5,052
Goodwill 2,779 3,036 3,389 1,892 1,892
Intangible assets 2,152 2,627 2,856 400 424
Investments 139 138 139 229 224
Other assets 2,303 1,881 1,402 905 1,115
$ 14,105 $ 13,834 $ 13,273 $ 8,465 $ 8,707
Liabilities and Shareholders’ Equity
Long-term debt (5) $ 6,988 $ 7,739 $ 8,542 $ 5,440 $ 6,319
Accounts payable and other liabilities 2,917 2,567 2,346 1,535 1,273
Future income taxes – – – – 28
Non-controlling interest – – – 193 133
Total liabilities 9,905 10,306 10,888 7,168 7,753
Shareholders’ equity 4,200 3,528 2,385 1,297 954
$ 14,105 $ 13,834 $ 13,273 $ 8,465 $ 8,707
Ratios:
Revenue growth 21% 33% 16% 12% 11%
Operating profit growth 34% 24% 20% 27% 20%
Debt (5)/operating profit 2.4 3.6 4.9 3.8 5.5
Dividends declared per share (6) $ 0.08 $ 0.06 $ 0.05 $ 0.05 $ –
(1) Certain current and prior year amounts related to equipment sales have been reclassified. See “Reclassification of Wireless Equipment Sales and Cost of Sales” section for further details.
(2) Operating profit is defined as income before depreciation, amortization, interest, income taxes, and non-operating items. See “Key Performance Indicators Non-GAAP Measures” section.
(3) Certain prior year amounts related to the adoption of EIC 162 have been restated.
(4) Cash flow from operations before changes in working capital amounts.
(5) Years ended December 31, 2004 and prior have been restated for a change in accounting of foreign exchange translation.
(6) Prior period shares and per share amounts have been retroactively adjusted to reflect a two-for-one-split of the Company’s Class A Voting and Class B Non-Voting shares on December 29, 2006.
During 2005, with the approval of the Board of Directors, we entered
into an arrangement to sell to our controlling shareholder, for
$13 million in cash, the shares in two wholly owned subsidiaries
whose only asset will consist of tax losses aggregating approximately
$100 million. The terms of the transaction were reviewed and
approved by a Special Committee of the Board of Directors com-
prised of independent directors. The Special Committee was advised
by independent counsel and engaged an accounting firm as part of
their review to ensure that the sale price was within a range that
would be fair from a financial point of view. Further to this arrange-
ment, on April 7, 2006, a company controlled by our controlling
shareholder purchased the shares in one of these wholly owned
subsidiaries for cash of $7 million. On July 24, 2006, the shares of
the second wholly owned subsidiary were purchased by a company
controlled by the controlling shareholder for cash of $6 million.