Rogers 2003 Annual Report Download - page 95
Download and view the complete annual report
Please find page 95 of the 2003 Rogers annual report below. You can navigate through the pages in the report by either clicking on the pages listed below, or by using the keyword search tool below to find specific information within the annual report.-
 1
1 -
2
-
3
-
4
-
5
-
6
-
7
-
8
-
9
-
10
-
11
-
12
-
13
-
14
-
15
-
16
-
17
-
18
-
19
-
20
-
21
-
22
-
23
-
24
-
25
-
26
-
27
-
28
-
29
-
30
-
31
-
32
-
33
-
34
-
35
-
36
-
37
-
38
-
39
-
40
-
41
-
42
-
43
-
44
-
45
-
46
-
47
-
48
-
49
-
50
-
51
-
52
-
53
-
54
-
55
-
56
-
57
-
58
-
59
-
60
-
61
-
62
-
63
-
64
-
65
-
66
-
67
-
68
-
69
-
70
-
71
-
72
-
73
-
74
-
75
-
76
-
77
-
78
-
79
-
80
-
81
-
82
-
83
-
84
-
 85
85 -
 86
86 -
 87
87 -
 88
88 -
 89
89 -
 90
90 -
 91
91 -
 92
92 -
 93
93 -
 94
94 -
 95
95 -
 96
96 -
 97
97 -
 98
98 -
 99
99 -
 100
100 -
 101
101 -
 102
102 -
 103
103 -
 104
104 -
 105
105 -
106
-
107
-
108
-
109
-
110
-
111
-
112
 |
 |

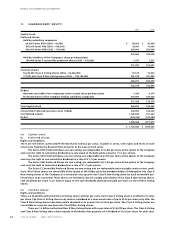
2003 Annual ReportRogers Communications Inc. 93
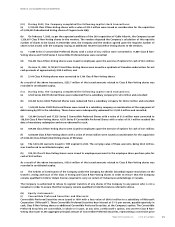
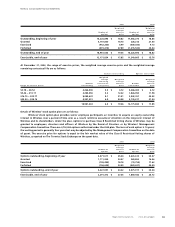
Notes to Consolidated Financial Statements
2003 2002
Weighted Weighted
average average
Number of exercise Number of exercise
options price options price
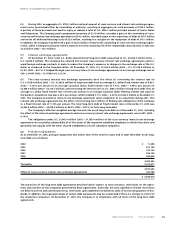
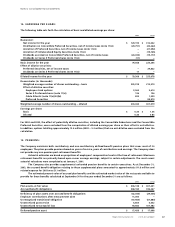
Outstanding, beginning of year 16,226,896 $ 18.82 17,463,270 $ 18.86
Granted 4,197,800 18.70 228,216 21.50
Exercised (952,250) 8.99 (449,045) 9.10
Forfeited (491,413) 27.89 (1,015,545) 24.44
Outstanding, end of year 18,981,033 $ 19.06 16,226,896 $ 18.82
Exercisable, end of year 12,171,834 $ 17.85 11,349,805 $ 15.76
At December 31, 2003, the range of exercise prices, the weighted average exercise price and the weighted average
remaining contractual life are as follows:
Options outstanding Options exercisable
Weighted
average Weighted Weighted
remaining average average
Number contractual exercise Number exercise
Range of exercise prices outstanding life (years) price exercisable price
$5.78 – $8.52 4,266,400 3.5 $ 6.72 4,266,400 $ 6.72
$9.46 – $13.17 2,283,550 5.2 12.22 1,826,050 11.98
$16.75 – $23.77 8,089,632 8.1 21.31 2,902,767 23.02
$25.44 – $38.16 4,341,451 6.9 30.58 3,176,617 31.44
18,981,033 6.4 $ 19.06 12,171,834 $ 17.85
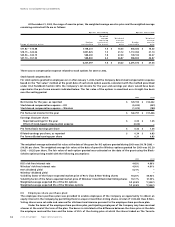
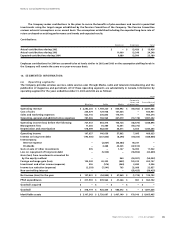
Details of Wireless’ stock option plan are as follows:
Wireless’ stock option plan provides senior employee participants an incentive to acquire an equity ownership
interest in Wireless over a period of time and, as a result, reinforce executives’ attention on the long-term interest of
Wireless and its shareholders. Under the plan, options to purchase Class B Restricted Voting shares of Wireless may be
granted to employees, directors and officers of Wireless by the Board of Directors or by Wireless’ Management
Compensation Committee. There are 4,750,000 options authorized under the 2000 plan. The term of each option is 10 years;
the vesting period is generally four years but may be adjusted by the Management Compensation Committee on the date
of grant. The exercise price for options is equal to the fair market value of the Class B Restricted Voting shares of
Wireless, as quoted on The Toronto Stock Exchange on the grant date.
2003 2002
Weighted Weighted
average average
Number of exercise Number of exercise
options price options price
Options outstanding, beginning of year 3,471,017 $ 25.04 3,641,613 $ 25.57
Granted 1,111,200 20.47 269,800 16.56
Exercised (158,495) 18.18 (19,759) 17.62
Forfeited (196,625) 22.39 (420,637) 24.50
Options outstanding, end of year 4,227,097 $ 24.22 3,471,017 $ 25.04
Exercisable, end of year 2,291,372 $ 27.36 1,869,442 $ 26.72