Rogers 2003 Annual Report Download - page 76
Download and view the complete annual report
Please find page 76 of the 2003 Rogers annual report below. You can navigate through the pages in the report by either clicking on the pages listed below, or by using the keyword search tool below to find specific information within the annual report.-
 1
1 -
2
-
3
-
4
-
5
-
6
-
7
-
8
-
9
-
10
-
11
-
12
-
13
-
14
-
15
-
16
-
17
-
18
-
19
-
20
-
21
-
22
-
23
-
24
-
25
-
26
-
27
-
28
-
29
-
30
-
31
-
32
-
33
-
34
-
35
-
36
-
37
-
38
-
39
-
40
-
41
-
42
-
43
-
44
-
45
-
46
-
47
-
48
-
49
-
50
-
51
-
52
-
53
-
54
-
55
-
56
-
57
-
58
-
59
-
60
-
61
-
62
-
63
-
64
-
65
-
 66
66 -
 67
67 -
 68
68 -
 69
69 -
 70
70 -
 71
71 -
 72
72 -
 73
73 -
 74
74 -
 75
75 -
 76
76 -
 77
77 -
 78
78 -
 79
79 -
 80
80 -
 81
81 -
 82
82 -
 83
83 -
 84
84 -
 85
85 -
 86
86 -
87
-
88
-
89
-
90
-
91
-
92
-
93
-
94
-
95
-
96
-
97
-
98
-
99
-
100
-
101
-
102
-
103
-
104
-
105
-
106
-
107
-
108
-
109
-
110
-
111
-
112
 |
 |

2003 Annual Report Rogers Communications Inc.
74
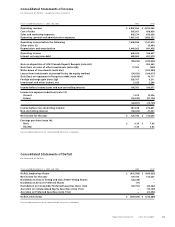
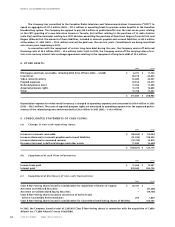
Consolidated Statements of Cash Flows
(In thousands of dollars)
Years ended December 31, 2003 and 2002 2003 2002
Cash provided by (used in):
Operating activities:
Net income for the year $ 129,193 $ 312,032
Adjustments to reconcile net income to net cash flows from operating activities:
Depreciation and amortization 1,040,263 981,458
Future income taxes (24,532) (87,126)
Non-controlling interest 58,425 (41,231)
Change in estimate of sales tax liability – (19,157)
Unrealized foreign exchange gain (290,661) (3,546)
Write-down of investments – 300,984
Loss (gain) on sales of other investments (17,902) 565
Gain on disposition of AT&T Canada Deposit Receipts – (904,262)
Loss (gain) on repayment of long-term debt 24,839 (10,117)
Losses from investments accounted for by the equity method 54,033 100,617
Accrued interest due on repayment of certain notes 10,167 10,767
Dividends from associated companies 924 1,449
984,749 642,433
Change in non-cash operating items (note 9(a)) (130,821) 126,116
853,928 768,549
Financing activities:
Issue of long-term debt 1,589,518 2,977,330
Repayment of long-term debt (1,691,480) (2,445,131)
Proceeds on termination of cross-currency interest rate exchange agreements – 225,210
Premium on early repayment of long-term debt (19,348) (21,773)
Financing costs incurred (6,220) (27,399)
Redemption of Preferred and Collateralized equity instruments – (1,317,040)
Issue of capital stock 252,011 5,729
Distribution on Convertible Preferred Securities (33,000) (33,000)
Dividends on Class B Non-Voting, Class A Voting and Series E Preferred shares (11,607) –
79,874 (636,074)
Investing activities:
Additions to property, plant and equipment (963,742) (1,261,983)
Proceeds on disposition of AT&T Canada Deposit Receipts – 1,280,357
Proceeds on sales of other investments 20,705 12,088
Acquisitions, net of cash acquired – (103,425)
Other investments (27,937) (49,829)
(970,974) (122,792)
Increase (decrease) in cash and cash equivalents (37,172) 9,683
Cash and cash equivalents, beginning of year 26,884 17,201
Cash and cash equivalents (deficiency), end of year $ (10,288) $ 26,884
Cash and cash equivalents (deficiency) are defined as cash and short-term deposits, which have an original maturity of less than 90 days,
less bank advances.
For supplemental cash flow information and disclosure of non-cash transactions, see note 9(b).
See accompanying notes to consolidated financial statements.