Rogers 2003 Annual Report Download - page 49
Download and view the complete annual report
Please find page 49 of the 2003 Rogers annual report below. You can navigate through the pages in the report by either clicking on the pages listed below, or by using the keyword search tool below to find specific information within the annual report.-
 1
1 -
2
-
3
-
4
-
5
-
6
-
7
-
8
-
9
-
10
-
11
-
12
-
13
-
14
-
15
-
16
-
17
-
18
-
19
-
20
-
21
-
22
-
23
-
24
-
25
-
26
-
27
-
28
-
29
-
30
-
31
-
32
-
33
-
34
-
35
-
36
-
37
-
38
-
 39
39 -
 40
40 -
 41
41 -
 42
42 -
 43
43 -
 44
44 -
 45
45 -
 46
46 -
 47
47 -
 48
48 -
 49
49 -
 50
50 -
 51
51 -
 52
52 -
 53
53 -
 54
54 -
 55
55 -
 56
56 -
 57
57 -
 58
58 -
 59
59 -
60
-
61
-
62
-
63
-
64
-
65
-
66
-
67
-
68
-
69
-
70
-
71
-
72
-
73
-
74
-
75
-
76
-
77
-
78
-
79
-
80
-
81
-
82
-
83
-
84
-
85
-
86
-
87
-
88
-
89
-
90
-
91
-
92
-
93
-
94
-
95
-
96
-
97
-
98
-
99
-
100
-
101
-
102
-
103
-
104
-
105
-
106
-
107
-
108
-
109
-
110
-
111
-
112
 |
 |

2003 Annual ReportRogers Communications Inc. 47
Wireless Network Revenue
Wireless network revenue in 2003, which accounted for 89.4% of Wireless’ total revenue, was $2,039.8 million, an increase
of 16.0% from 2002. This revenue growth reflects the 11.2% increase in the number of wireless voice and data subscribers
over fiscal 2002 and a 4.9% year-over-year increase in blended postpaid and prepaid ARPU.
Postpaid voice and data subscriber additions in 2003 represented 79.9% of total gross activations and close to
100% of total net additions. Wireless continued its strategy of targeting higher value postpaid subscribers and selling its
prepaid handsets at higher price points which contributed significantly to the mix of postpaid versus prepaid subscribers.
The 2.9% increase in average monthly revenue per postpaid voice and data subscriber compared to the previous
year reflected the continued activation and retention of higher valued customers, increased penetration of enhanced ser-
vices, and the continued growth of wireless data and roaming revenues. The growth in data revenues from $30.2 million
to $67.9 million represented approximately 63.0% of the 2.9% ARPU increase. Prepaid ARPU remained relatively flat on a
year-over-year basis.
The continuing trend to lower postpaid voice and data subscriber churn, as reflected in the 1.88% rate in 2003 ver-
sus 1.98% in 2002, is directly related to both Wireless’ strategy of acquiring higher value, more stable customers on longer
term contracts and an enhanced focus on customer retention. Wireless’ focus on customer retention aims to ensure that
customers receive responsive, quality service at every point of contact with Wireless. Wireless attributes the increase in
prepaid churn to 2.82% in the current year to the impact of competitive prepaid offers.
One-way messaging (or “paging”) subscriber churn has remained relatively stable on a year over year basis declin-
ing to 3.13% in 2003 from 3.20% in the previous year. With 241,300 paging subscribers, Wireless continues to view paging
as a profitable but mature business segment and recognizes that churn will likely continue at relatively high rates as one-
way messaging subscribers increasingly migrate to two-way messaging and converged voice and data services.
Wireless Equipment Sales Revenue
In 2003, revenue from wireless voice, data and messaging equipment sales was $242.4 million, up $35.7 million, or 17.3%,
from the prior year. The increase in equipment revenues reflects both the higher cost of more sophisticated handsets and
devices and the significantly higher volume of postpaid voice and data customer gross additions. However, this increase
in sales does not materially affect Wireless’ operating profit as Wireless generally sells equipment to distribution at a
price approximating cost to facilitate competitive pricing at the retail level.
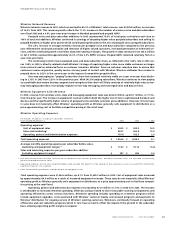
Wireless Operating Expenses
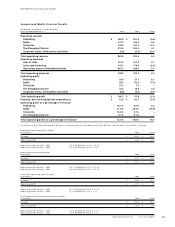
(In millions of dollars, except per subscriber statistics)
Years Ended December 31, 2003 2002 % Chg
Operating expenses1 2
Cost of equipment sales $ 244.5 $ 209.9 16.5
Sales and marketing3522.7 462.8 12.9
Operating, general and administrative expenses 787.4 765.5 2.9
Total operating expenses $ 1,554.6 $ 1,438.2 8.1
Average monthly operating expense per subscriber before sales,
marketing and equipment margin1 2 $ 17.22 $ 18.16 (5.2)
Sales and marketing expenses per gross subscriber addition
(including equipment margin)1$ 397 $ 384 3.4
1 The 2002 presentation has been reclassified to conform to the current presentation. Customer retention costs are included in operating,
general and administrative costs.
2 Operating expenses for the year ended December 2002 exclude the benefit of the change in the estimate of sales tax and CRTC contribution
liabilities items of $12.3 million.
3 Sales and marketing expenses exclude margin on equipment sales.
Total operating expenses were $1,554.6 million, up 8.1% from $1,438.2 million in 2002. Cost of equipment sales increased
by approximately $34.6 million as a result of increased equipment revenues. These costs do not materially affect Wireless’
operating profit as Wireless generally sells equipment to distributors at a price approximating cost to facilitate competi-
tive pricing at the retail level.
Operating, general and administrative expenses increased by $21.9 million or 2.9% in 2003 over 2002. The increase
is attributable to increased retention spending, offset by savings related to more favourable roaming arrangements and
operating efficiencies across various functions. Retention spending includes spending on retention programs which
include equipment upgrades, costs associated with Wireless’ customer loyalty and renewal programs and payments to
Wireless’ distributors for ongoing service of Wireless’ existing customers. Wireless is continually focused on operating
efficiencies and cost reduction programs which in turn have served to offset the impact of the growth in the subscriber
base, allowing operating profit margins to expand.
Management’s Discussion and Analysis