Rogers 2003 Annual Report Download - page 33
Download and view the complete annual report
Please find page 33 of the 2003 Rogers annual report below. You can navigate through the pages in the report by either clicking on the pages listed below, or by using the keyword search tool below to find specific information within the annual report.-
 1
1 -
2
-
3
-
4
-
5
-
6
-
7
-
8
-
9
-
10
-
11
-
12
-
13
-
14
-
15
-
16
-
17
-
18
-
19
-
20
-
21
-
22
-
 23
23 -
 24
24 -
 25
25 -
 26
26 -
 27
27 -
 28
28 -
 29
29 -
 30
30 -
 31
31 -
 32
32 -
 33
33 -
 34
34 -
 35
35 -
 36
36 -
 37
37 -
 38
38 -
 39
39 -
 40
40 -
 41
41 -
 42
42 -
 43
43 -
44
-
45
-
46
-
47
-
48
-
49
-
50
-
51
-
52
-
53
-
54
-
55
-
56
-
57
-
58
-
59
-
60
-
61
-
62
-
63
-
64
-
65
-
66
-
67
-
68
-
69
-
70
-
71
-
72
-
73
-
74
-
75
-
76
-
77
-
78
-
79
-
80
-
81
-
82
-
83
-
84
-
85
-
86
-
87
-
88
-
89
-
90
-
91
-
92
-
93
-
94
-
95
-
96
-
97
-
98
-
99
-
100
-
101
-
102
-
103
-
104
-
105
-
106
-
107
-
108
-
109
-
110
-
111
-
112
 |
 |

2003 Annual ReportRogers Communications Inc. 31
Write-down of Investments
The Company reviewed the carrying value of all investments and determined no write-downs were required in 2003.
In 2002, as part of its annual review of the carrying value of investments, the Company determined a write-down
in the amount of $301.0 million was required. The largest component of this write-down in 2002 related to the Company’s
investment in Cogeco Cable Inc. and Cogeco Inc., which accounted for $238.9 million of the total. Cogeco shares were
written down to the December 31, 2002 publicly traded value on the basis that the market price at that time reflected
management’s best estimate of the fair value of the investment.
During 2002, the Company’s other investments were reviewed, and it was determined that write-down of approx-
imately $62.1 million was required based on publicly traded values and estimated values of privately held companies.
Gain on Disposition of AT&T Canada Deposit Receipts
In 2002, AT&T Corp. (“AT&T”) purchased for cash the deposit receipts of AT&T Canada Inc. (“AT&T Canada”). The Company
received cash proceeds of $1.28 billion, which, after taking into account the carrying costs of the investment and related
costs, resulted in a pre-tax gain of $904.3 million. The proceeds were used by the Company, together with other funds, to
redeem the Company’s outstanding Preferred Securities and to settle the Collateralized Equity Securities associated with
the previous monetizations by the Company of its AT&T Canada investment.
Other Income
This includes interest earned on cash deposits. In 2002, the amount was offset by the accretion on the Preferred Securities
and Collateralized Equity Securities as described in Note 11(c) to the Consolidated Financial Statements.
Income Taxes
Income tax expense consists of large corporations tax and is calculated under Canadian GAAP as outlined in Note 13 to the
Consolidated Financial Statements.
Non-Controlling Interest
Non-controlling interest, representing a 44.2% interest in Wireless’ net income, was an expense of $58.4 million in 2003 as
compared to a gain of $41.2 million in 2002. The year-over-year change represents the significant year-over-year improve-
ment in Wireless’ net income which was in a loss position in 2002.
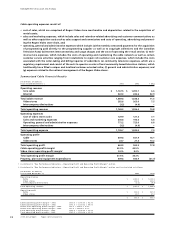
Net Income and Earnings per Share
The Company recorded net income of $129.2 million in 2003, or $0.35 per share, compared to net income of $312.0 million
in 2002, or $1.05 per share. In 2003, the weighted average number of Class A Voting Shares and Class B Non-Voting Shares
outstanding increased to 225.9 million from 213.6 million in 2002. The number of shares and the earnings per share (“EPS”)
amount stated above reflect basic earnings per share.
EMPLOYEES
At December 31, 2003, the Company had approximately 15,000 full-time equivalent employees (“FTE”) across all of its
operating groups, including the Company’s shared services organization and corporate office, representing an increase of
approximately 100 FTEs from the levels of December 31, 2002. The employment level increase primarily reflects increased
sales staff customer service staff, partially offset by staff reductions in other groups resulting from operating efficiencies.
For details of Cable, Wireless and Media employee levels, please refer to the respective discussions below.
Total remuneration paid to employees (both full and part time) in 2003 was approximately $801.0 million, an
increase of $30.0 million, or 3.9%, from $771.0 million in the prior year.
ROGERS CABLE
CABLE OVERVIEW
Rogers Cable is Canada’s largest cable television company, serving close to 2.3 million basic subscribers, representing
approximately 29% of basic cable subscribers in Canada. Cable also provides digital cable services to approximately
535,300 subscribers and Internet service to approximately 790,500 subscribers at December 31, 2003.
Cable has highly-clustered and technologically advanced broadband networks in Ontario, New Brunswick and
Newfoundland. Cable’s Ontario cable systems, which comprise approximately 90% of its 2.3 million basic cable subscribers,
are concentrated in three principal clusters in and around: (i) the greater Toronto area, Canada’s largest metropolitan
centre; (ii) Ottawa, the national capital city of Canada; and (iii) the Guelph to London corridor in southern Ontario. Cable’s
New Brunswick and Newfoundland cable systems in Atlantic Canada comprise the balance of its subscribers.
Management’s Discussion and Analysis