Rogers 2003 Annual Report Download - page 75
Download and view the complete annual report
Please find page 75 of the 2003 Rogers annual report below. You can navigate through the pages in the report by either clicking on the pages listed below, or by using the keyword search tool below to find specific information within the annual report.-
 1
1 -
2
-
3
-
4
-
5
-
6
-
7
-
8
-
9
-
10
-
11
-
12
-
13
-
14
-
15
-
16
-
17
-
18
-
19
-
20
-
21
-
22
-
23
-
24
-
25
-
26
-
27
-
28
-
29
-
30
-
31
-
32
-
33
-
34
-
35
-
36
-
37
-
38
-
39
-
40
-
41
-
42
-
43
-
44
-
45
-
46
-
47
-
48
-
49
-
50
-
51
-
52
-
53
-
54
-
55
-
56
-
57
-
58
-
59
-
60
-
61
-
62
-
63
-
64
-
 65
65 -
 66
66 -
 67
67 -
 68
68 -
 69
69 -
 70
70 -
 71
71 -
 72
72 -
 73
73 -
 74
74 -
 75
75 -
 76
76 -
 77
77 -
 78
78 -
 79
79 -
 80
80 -
 81
81 -
 82
82 -
 83
83 -
 84
84 -
 85
85 -
86
-
87
-
88
-
89
-
90
-
91
-
92
-
93
-
94
-
95
-
96
-
97
-
98
-
99
-
100
-
101
-
102
-
103
-
104
-
105
-
106
-
107
-
108
-
109
-
110
-
111
-
112
 |
 |

2003 Annual ReportRogers Communications Inc. 73
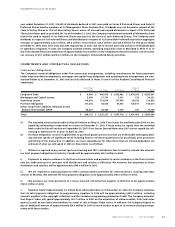
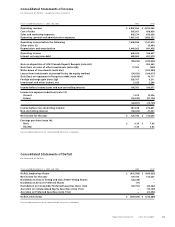
Consolidated Statements of Income
(In thousands of dollars, except per share amounts)
Years ended December 31, 2003 and 2002 2003 2002
Operating revenue $ 4,847,363 $ 4,323,045
Cost of sales 505,951 458,838
Sales and marketing expenses 905,274 833,038
Operating, general and administrative expenses 1,987,242 1,889,555
Operating income before the following 1,448,896 1,141,614
Other (note 12) – (6,481)
Depreciation and amortization 1,040,263 981,458
Operating income 408,633 166,637
Interest on long-term debt 488,865 491,279
(80,232) (324,642)
Gain on disposition of AT&T Canada Deposit Receipts (note 6(c)) – 904,262
Gain (loss) on sales of other investments (note 6(d)) 17,902 (565)
Write-down of investments (note 6(e)) – (300,984)
Losses from investments accounted for by the equity method (54,033) (100,617)
Gain (loss) on repayment of long-term debt (note 10(e)) (24,839) 10,117
Foreign exchange gain (note 2(g)) 303,707 6,211
Investment and other income, net 2,256 2,289
Income before income taxes and non-controlling interest 164,761 196,071
Income tax expense (reduction) (note 13):
Current 1,675 12,396
Future (24,532) (87,126)
(22,857) (74,730)
Income before non-controlling interest 187,618 270,801
Non-controlling interest (58,425) 41,231
Net income for the year $ 129,193 $ 312,032
Earnings per share (note 14):
Basic $ 0.35 $ 1.05
Diluted 0.34 0.83
See accompanying notes to consolidated financial statements.
Consolidated Statements of Deficit
(In thousands of dollars)
Years ended December 31, 2003 and 2002 2003 2002
Deficit, beginning of year $ (415,589) $ (660,022)
Net income for the year 129,193 312,032
Dividends on Class A Voting and Class B Non-Voting Shares (23,238) –
Dividends on Series E Preferred Shares (11) –
Distribution on Convertible Preferred Securities (note 11(c)) (29,791) (20,262)
Accretion on Collateralized Equity Securities (note 11(c)) – (19,745)
Accretion on Preferred Securities (note 11(c)) – (27,592)
Deficit, end of year $ (339,436) $ (415,589)
See accompanying notes to consolidated financial statements.