Rogers 2003 Annual Report Download - page 70
Download and view the complete annual report
Please find page 70 of the 2003 Rogers annual report below. You can navigate through the pages in the report by either clicking on the pages listed below, or by using the keyword search tool below to find specific information within the annual report.-
 1
1 -
2
-
3
-
4
-
5
-
6
-
7
-
8
-
9
-
10
-
11
-
12
-
13
-
14
-
15
-
16
-
17
-
18
-
19
-
20
-
21
-
22
-
23
-
24
-
25
-
26
-
27
-
28
-
29
-
30
-
31
-
32
-
33
-
34
-
35
-
36
-
37
-
38
-
39
-
40
-
41
-
42
-
43
-
44
-
45
-
46
-
47
-
48
-
49
-
50
-
51
-
52
-
53
-
54
-
55
-
56
-
57
-
58
-
59
-
 60
60 -
 61
61 -
 62
62 -
 63
63 -
 64
64 -
 65
65 -
 66
66 -
 67
67 -
 68
68 -
 69
69 -
 70
70 -
 71
71 -
 72
72 -
 73
73 -
 74
74 -
 75
75 -
 76
76 -
 77
77 -
 78
78 -
 79
79 -
 80
80 -
81
-
82
-
83
-
84
-
85
-
86
-
87
-
88
-
89
-
90
-
91
-
92
-
93
-
94
-
95
-
96
-
97
-
98
-
99
-
100
-
101
-
102
-
103
-
104
-
105
-
106
-
107
-
108
-
109
-
110
-
111
-
112
 |
 |

2003 Annual Report Rogers Communications Inc.
68
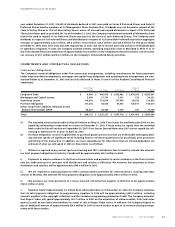
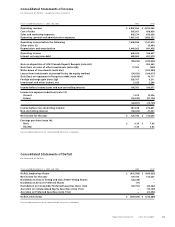
(thousands of dollars, except per share amounts)
Years ended December 31 2003 2002 2001 2000 1999
Income and Cash Flow
Operating Revenue
Cable $ 1,769,220 $ 1,596,401 $ 1,433,029 $ 1,291,161 $ 1,148,519
Wireless 2,282,203 1,965,927 1,753,145 1,639,104 1,418,579
Media 854,992 810,805 721,710 681,023 607,604
Corporate and eliminations (59,052) (50,088) 4,772 – –
4,847,363 4,323,045 3,912,656 3,611,288 3,174,702
Operating Profit1
Cable 663,474 563,480 516,805 457,777 411,205
Wireless 727,572 527,687 411,945 410,924 422,328
Media 106,724 87,635 68,306 77,390 77,252
Corporate and eliminations (48,874) (37,188) (44,535) (28,366) (16,957)
1,448,896 1,141,614 952,521 917,725 893,828
Net Income (loss)3$ 129,193 $ 312,032 $ (464,361) $ 127,520 $ 977,916
Cash flow from operations2$ 984,749 $ 642,433 $ 470,471 $ 770,781 $ 495,200
Property, plant and equipment, net $ 963,742 $ 1,261,983 $ 1,420,747 $ 1,212,734 $ 832,423
Average Class A and Class B shares
outstanding (000’s) 225,918 213,570 208,644 203,761 189,805
Per Share Earnings (loss) – basic $ 0.35 $ 1.05 $ (2.56) $ 0.37 $ 5.01
Balance Sheet
Assets
Property, plant and equipment, net $ 5,039,304 $ 5,051,998 $ 4,717,731 $ 4,047,329 $ 3,539,160
Goodwill and other intangible assets 2,291,855 2,315,734 2,134,925 1,601,433 1,379,582
Investments 229,221 223,937 1,047,888 972,648 554,241
Other assets 905,115 932,834 909,835 1,127,190 683,627
$ 8,465,495 $ 8,524,503 $ 8,810,379 $ 7,748,600 $ 6,156,610
Liabilities and Shareholders’ Equity (Deficiency)
Long-term debt $ 5,305,016 $ 5,687,471 $ 4,990,357 $ 3,957,662 $ 3,594,966
Accounts payable and other liabilities 1,199,757 1,272,745 1,192,165 1,232,463 1,016,754
Future income taxes – 27,716 137,189 145,560 138,803
Non-controlling interest 193,342 132,536 186,377 88,683 132,459
Shareholders’ equity (deficiency) 1,767,380 1,404,035 2,304,291 2,324,232 1,273,628
$ 8,465,495 $ 8,524,503 $ 8,810,379 $ 7,748,600 $ 6,156,610
1 As defined in “Key Performance Indicators – Operating Profit and Profit Margin” section.
2 Cash flow from operations before changes in working capital amounts.
3 Restated for the change in accounting of foreign exchange translation.
Five Year Financial Summary