Rogers 2003 Annual Report Download - page 71
Download and view the complete annual report
Please find page 71 of the 2003 Rogers annual report below. You can navigate through the pages in the report by either clicking on the pages listed below, or by using the keyword search tool below to find specific information within the annual report.-
 1
1 -
2
-
3
-
4
-
5
-
6
-
7
-
8
-
9
-
10
-
11
-
12
-
13
-
14
-
15
-
16
-
17
-
18
-
19
-
20
-
21
-
22
-
23
-
24
-
25
-
26
-
27
-
28
-
29
-
30
-
31
-
32
-
33
-
34
-
35
-
36
-
37
-
38
-
39
-
40
-
41
-
42
-
43
-
44
-
45
-
46
-
47
-
48
-
49
-
50
-
51
-
52
-
53
-
54
-
55
-
56
-
57
-
58
-
59
-
60
-
 61
61 -
 62
62 -
 63
63 -
 64
64 -
 65
65 -
 66
66 -
 67
67 -
 68
68 -
 69
69 -
 70
70 -
 71
71 -
 72
72 -
 73
73 -
 74
74 -
 75
75 -
 76
76 -
 77
77 -
 78
78 -
 79
79 -
 80
80 -
 81
81 -
82
-
83
-
84
-
85
-
86
-
87
-
88
-
89
-
90
-
91
-
92
-
93
-
94
-
95
-
96
-
97
-
98
-
99
-
100
-
101
-
102
-
103
-
104
-
105
-
106
-
107
-
108
-
109
-
110
-
111
-
112
 |
 |

2003 Annual ReportRogers Communications Inc. 69
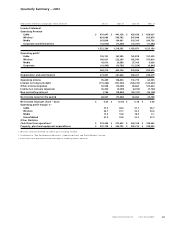
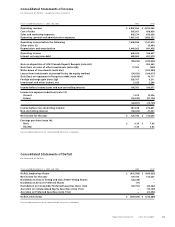
(thousands of dollars, except per share amounts) Dec 31 Sept 30 June 30 Mar 31
Income Statement
Operating Revenue
Cable $ 470,647 $ 441,128 $ 429,438 $ 428,007
Wireless1624,684 599,792 547,848 509,879
Media 243,869 194,691 219,706 196,726
Corporate and eliminations (16,920) (17,329) (13,341) (11,462)
1,322,280 1,218,282 1,183,651 1,123,150
Operating profit2
Cable 176,721 167,585 161,878 157,290
Wireless 166,921 222,295 182,546 155,810
Media 42,610 20,988 37,106 6,020
Corporate (16,942) (10,762) (11,324) (9,846)
369,310 400,106 370,206 309,274
Depreciation and amortization 273,851 261,666 256,427 248,319
Operating income 95,459 138,440 113,779 60,955
Interest on long-term debt (115,364) (121,944) (128,010) (123,547)
Other income (expense) 50,558 (12,045) 96,860 109,620
Income tax recovery (expense) 36,400 (3,039) (3,372) (7,132)
Non-controlling interest 1,784 (18,854) (25,197) (16,158)
Net income (loss) for the period 68,837 (17,442) 54,060 23,738
Net income (loss) per share – basic $ 0.24 $ (0.13) $ 0.18 $ 0.06
Operating profit margin %2
Cable 37.5 38.0 37.7 36.7
Wireless 26.7 37.1 33.3 30.6
Media 17.5 10.8 16.9 3.1
Consolidated 27.9 32.8 31.3 27.5
Other Statistics
Cash flow from operations3$ 274,496 $ 277,602 $ 244,108 $ 188,543
Property, plant and equipment expenditures $ 307,758 $ 244,722 $ 222,312 $ 188,950
1 Wireless revenue restated to reflect gross roaming revenue.
2 As defined in “Key Performance Indicators – Operating Profit and Profit Margin” section.
3 Cash flow from operations before changes in working capital amounts.
Quarterly Summary – 2003